![]()
![]()
![]()
GridVisualize
Plotting companion module for ExtendableGrids.jl Provides grid and scalar piecewise linear function plotting for various plotting backends on simplicial grids in one, two or three space dimensions. The main supported backends are PyPlot, GLMakie and PlutoVista.
Disclaimer
The code is rather new and quite a few codepaths are untested. Please be prepared to help fixing things.
Sample usage:
Plotting a grid, a function or a vector field
gridplot(grid, Plotter=PyPlot)
scalarplot(grid, function,Plotter=PyPlot)
vectorplot(grid, vectorfunction,Plotter=PyPlot)
streamplot(grid, vectorfunction,Plotter=PyPlot)
This works for 1/2/3D grids and either a function represented by its values on the nodes of the grid, or a scalar function of 1, 2 or 3 variables, respectively. Vector plots are currenly available for 2D only, and stream plots only for PyPlot.
Plot appearance can be tweaked by a number of keyword arguments.
Plotters
Plotters can be e.g. Plots, GLMakie, PlutoVista - we pass the module exported by the package. Different plotters can be used at the same time.
Multiple plots in one plotting window
vis=GridVisualizer(Plotter=GLMakie, layout=(1,2))
gridplot!(vis[1,1],grid)
scalarplot!(vis[1,2],grid,function)
reveal(vis)
(not supported by PlutoVista)
Transient plots
This using fast updating via observables for GLMakie and persistent divs with PlutoVista.
vis=GridVisualizer(Plotter=GLMakie)
for i=1:N
   function=calculate(i)
   scalarplot!(vis,grid,function)
   reveal(vis)
end
Setting a default plotter
Instead of specifying a Plotter in calls to GridVisualizer,
gridplot or scalarplot, a default plotter can be set:
default_plotter!(PyPlot)
gridplot(grid)
scalarplot(grid, function)
or
default_plotter!(GLMakie)
vis=GridVisualizer(layout=(1,2))
gridplot!(vis[1,1],grid)
scalarplot!(vis[1,2],grid,function)
When the package is loaded, the default plotter is determined by the installed plotting package (using Requires.jl).
Switching off plotting
Just pass Plotter=nothing in the respective places, or set default_plotter!(nothing)
and all plotting functions will do nothing.
Available plotting backends and functionality.
- 'y': available
- 'i': some level of interactive control
- '(y)': availability only on rectangular grids
- 'p': planned
| PyPlot | GLMakie | PlutoVista | Plots | VTKView | |
|---|---|---|---|---|---|
| scalarplot, 1D | y | y | y,i | y | y |
| gridplot, 1D | y | y | y | y | |
| scalarplot, 2D | y | y | y | (y) | y,i |
| vectorplot, 2D | y | y | y | y | |
| streamplot, 2D | y | p | p | ||
| gridplot, 2D | y | y,i | y | (y) | y,i |
| scalarplot, 3D | y | y,i | y,i | y,i | |
| gridplot, 3D | y | y,i | y,i | y,i | |
| vectorplot, 3D | p | p | p | ||
| streamplot, 3D | p | p |
Sample output
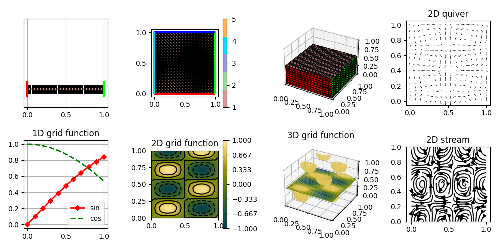
PyPlot:
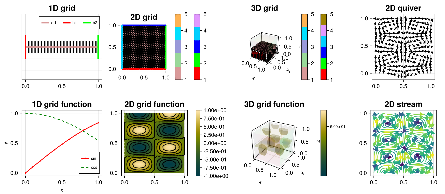
GLMakie:
Plots/gr:

VTKView:

Notebooks
Pluto
Plotting in Pluto notebooks for PyPlot, Plots, GLMakie is working.
Plotting in Pluto notebooks can use PlutoVista.jl based on plotly.js (1D) and vtk.js (2/3D). See the example notebook: pluto, html.
Jupyter
Chances are that things work with Jupyter as well. Please ping me if you would like to volunteer with testing and possibly fixing this.