InteractiveViz.jl
Interactive visualization tools for Julia
Yet another plotting package?
Julia already has a rich set of plotting tools in the form of the Plots and Makie ecosystems, and various backends for these. So why another plotting package?
InteractiveViz is not a replacement for Plots or Makie, but rather a graphics pipeline system developed on top of Makie. It has a few objectives:
- To provide a simple API to visualize large datasets (tens of millions of data points) easily.
- To enable interactivity, and be responsive even with large amounts of data.
- To render perceptually accurate summaries at large scale, allowing drill down to individual data points.
- To allow generation of data points on demand through a graphics pipeline, requiring computation only at a level of detail appropriate for display at the viewing resolution. Additional data points can be generated on demand when zooming or panning.
This package was partly inspired by the excellent Datashader package available in the Python ecosystem.
This package does not aim to provide comprehensive production quality plotting. It is aimed at interactive exploration of large datasets.
Installation
julia>]
pkg> add InteractiveViz
pkg> add GLMakie
Dependencies
You'll need Makie to see the plots InteractiveViz generates.
Usage
Detailed documentation for this package is still work-in-progress. The following examples should get you started:
Let's start off visualizing a simple function of one variable:
julia> using InteractiveViz
julia> using GLMakie
julia> iplot(sin, 0, 100);

This displays the sin() function with the initial view set to the x-range of 0 to 100. You can however, pan and zoom beyond this range. Use the scroll wheel on your mouse, scroll gesture on your trackpad, or the arrow keys on your keyboard to pan. Draw selection box with your mouse to zoom, or use the "-", "+", "[" and "]" keys to zoom out/in in y/x axes.
The first plot may take some time to show, as is common in the Julia ecosystem. If you want to speed this up, consider precompiling Makie into your system image.
Let's next try plotting 2 timeseries, each with 10 million points:
julia> iplot(hcat(5*sin.(0.02π .* (1:10000000)), randn(10000000)));

You can zoom and pan to see details:

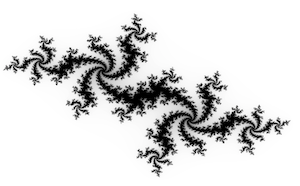
Next, let us visualize the famous Mandelbrot set:
julia> using InteractiveViz.demo
julia> iheatmap(mandelbrot, -2, 0.66, -1, 1; overlay=true, axescolor=:white, cursor=true);

Try zooming in to a tiny part of the image, and see the fractal nature of the image render itself dynamically at full resolution!

And how can we forget the Julia set?
julia> using InteractiveViz.demo
julia> iheatmap(julia, -2, 2, -1.75, 1.75; overlay=true, axescolor=:white, colormap=:magma);

You could of course plot a large heatmap stored in a matrix as well.
julia> iheatmap(randn(1000,10000), 0, 10, 0, 1);
By default, when the data is reduced to screen resolution, the graphics pipeline takes the mean of all data points mapped to a single pixel. While this is typically what you want, if you were looking for tiny peaks in the image, they may be averaged out and lost. You can change the pooling=maximum to modify this behavior.
Finally, let's try a scatter plot with a million points:
julia> iscatter(randn(1000000), randn(1000000); aggregate=true);
The aggregate=true option uses the graphics pipeline to reduce the data to screen resolution for plotting. This produces a responsive plot, but reduces the options you have for overlaying, adding color, or using other markers. If you wanted to avail those, don't aggregate:
julia> iscatter!(randn(10000) .- 1, randn(10000) .- 1; color=:blue);
The "!" versions of the plotting functions overlay the new plot on the previous plot, keeping the same x and y scales as far as possible.

You can add axes labels with keyword options xlabel and ylabel:
julia> iplot(sin, 0, 100; xlabel="time (samples)", ylabel="voltage");
While we haven't documented all the keyword options here, you'll find that most of the plot attributes for Makie work as options in InteractiveViz.
While InteractiveViz has much more to offer (multiple plots, linked axes, pan/zoom restrictions, etc) than the above use cases, the API is still evolving, and not yet documented. Other features such as colorbars and legends are work-in-progress and should be ready soon.
Interactivity
Mouse or touchpad may be used for panning (scroll gestures) and zooming (select area to zoom, right click to reset zoom). All interactions are also supported with keyboard bindings:
-/+          y-axis zoom out/in
[/]          x-axis zoom out/in
</>          brightness decrease/increase (heatmaps)
;/'          contrast decrease/increase (heatmaps)
arrow keys   pan left/right/up/down
0            reset zoom, pan, and color axis
The keymap can be modified if desired (see discussion for details).
To enable data cursor (to get x, y and value (heatmaps) using mouse pointer), simply add cursor=true keyword argument to any of the plots.
Feedback and comments
This package is in beta, and we welcome feedback and comments. Post them as issues against this repository.