SignalTables
![]()
![]()
Package SignalTables (see docu) provides abstract and concrete types and functions for signal tables. A signal table is basically a table where the table columns can be multi-dimensional arrays with attributes. Typically, simulation results, reference signals, table-based input signals, measurement data, look-up tables can be represented by a signal table.
A signal table is an ordered dictionary of signals with string keys. A signal can be defined in the following forms:
- As Var dictionary that has a required values key
(or an alias key) representing a signal array of any element type as function of the independent signal(s) (or is the k-th independent signal). A signal array is a multi-dimensional array with indices
[i1,i2,...,j1,j2,...]to hold variable elements[j1,j2,...]at the[i1,i2,...]independent signal(s). If an element of a signal array is not defined, it has a value of missing. - As Par dictionary that has a required value key (or and alias key) representing a constant of any type.
- As Map dictionary that has no required keys and collects attributes/meta-data that are associated with a Var, Par, Map, or signal table dictionary.
In all these dictionaries, additional attributes can be stored, for example unit, info, variability (continuous, clocked, ...), interpolation, extrapolation, and user-defined attributes.
This logical view is directly mapped to Julia data structures, but can be also mapped to data structures in other programming languages. It is then possible to use existing textual or binary persistent serialization formats (JSON, HDF5, BSON, MessagePack, ...) to store a signal table in these formats on file. Furthermore, a subset of a signal table can also be stored in traditional tables (Excel, CSV, pandas, DataFrames.jl, ...) by flattening the multi-dimensional arrays and not storing constants and attributes.
Examples
using SignalTables

t = 0.0:0.1:0.5
sigTable = SignalTable(
  "time"         => Var(values= t, unit="s", independent=true),
  "load.r"       => Var(values= [sin.(t) cos.(t) sin.(t)], unit="m"),
  "motor.angle"  => Var(values= sin.(t), unit="rad", state=true, der="motor.w"),
  "motor.w"      => Var(values= cos.(t), unit="rad/s"),
  "motor.w_ref"  => Var(values= 0.9*[sin.(t) cos.(t)], unit = ["rad", "1/s"],
                                info="Reference angle and speed"),
  "wm"           => Var(alias = "motor.w"),
  "ref.clock"    => Var(values= [true, missing, missing, true, missing, missing],
                                 variability="clock"),
  "motor.w_c"    => Var(values= [0.8, missing, missing, 1.5, missing, missing],
                                variability="clocked", clock="ref.clock"),
  "motor.inertia"=> Par(value = 0.02f0, unit="kg*m/s^2"),
  "motor.data"   => Par(value = "resources/motorMap.json"),
  "attributes"   => Map(experiment=Map(stoptime=0.5, interval=0.01))
)

phi_m_sig = getSignal(        sigTable, "motor.angle")   # = Var(values=..., unit=..., ...)
phi_m     = getValuesWithUnit(sigTable, "motor.angle")   # = [0.0, 0.0998, 0.1986, ...]u"rad"
w_c       = getValues(        sigTable, "motor.w_c"  )   # = [0.8, missing, missing, 1.5, ...]
inertia   = getValueWithUnit( sigTable, "motor.inertia") # = 0.02u"kg*m/s^2"
getValues(sigTable, "motor.w") === getValues(sigTable, "wm")

showInfo(sigTable)
Command showInfo generates the following output:
name          unit           size  eltypeOrType           kind attributes
───────────────────────────────────────────────────────────────────────────────────────────────────────
time          "s"            [6]   Float64                Var  independent=true
load.r        "m"            [6,3] Float64                Var
motor.angle   "rad"          [6]   Float64                Var  state=true, der="motor.w"
motor.w       "rad/s"        [6]   Float64                Var
motor.w_ref   ["rad", "1/s"] [6,2] Float64                Var  info="Reference angle and speed"
wm            "rad/s"        [6]   Float64                Var  alias="motor.w"
ref.clock                    [6]   Union{Missing,Bool}    Var  variability="clock"
motor.w_c                    [6]   Union{Missing,Float64} Var  variability="clocked", clock="ref.clock"
motor.inertia "kg*m/s^2"           Float32                Par
motor.data                         String                 Par
attributes                                                Map  experiment=Map(stoptime=0.5, interval=0.01)
The various Julia FileIO functions can be directly used to save a signal table in various formats, e.g. JSON or HDF5 (see FileIO Examples, json file of sigTable above ).
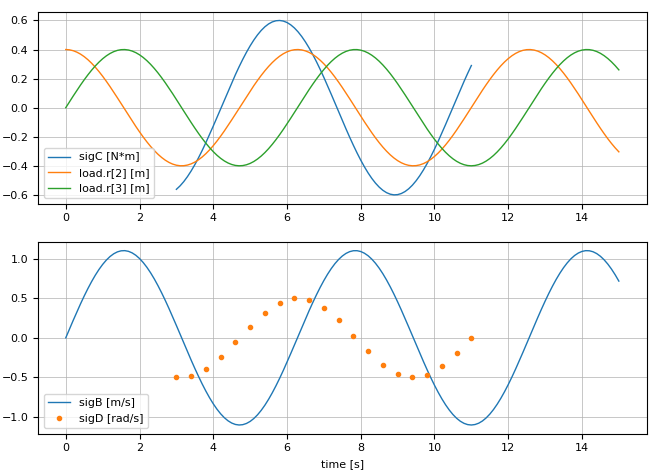
using SignalTable
usePlotPackage("PyPlot")    # or ENV["SignalTablesPlotPackage"] = "PyPlot"

sigTable = getSignalTableExample("MissingValues")

@usingPlotPackage                           # = using SignalTablesInterface_PyPlot
plot(sigTable, [("sigC", "load.r[2:3]"), ("sigB", "sigD")])  # generate plots
generate the following plot:
Concrete implementations of the Abstract Signal Table Interface are provided for:
-
SignalTable(included in SignalTables.jl). -
Modia.jl (a modeling and simulation environment; version >= 0.9.0)
-
DataFrames.jl (tabular data; first column is independent variable; only scalar variables))
-
Tables.jl (abstract tables, e.g. CSV tables; first column is independent variable; only scalar variables).
Concrete implementations of the Abstract Plot Interface are provided for:
-
PyPlot (plots with Matplotlib from Python; via SignalTablesInterface_PyPlot.jl),
-
GLMakie (interactive plots in an OpenGL window; via SignalTablesInterface_GLMakie.jl),
-
WGLMakie (interactive plots in a browser window; via SignalTablesInterface_WGLMakie.jl),
-
CairoMakie (static plots on file with publication quality; via SignalTablesInterface_CairoMakie.jl).
Furthermore, there is a dummy implementation included in SignalTables that is useful when performing tests with runtests.jl, in order that no plot package needs to be loaded during the tests:
- SilentNoPlot (= all plot calls are silently ignored).
Installation
julia> ]add SignalTables
        add SignalTablesInterface_PyPlot        # if plotting with PyPlot desired
        add SignalTablesInterface_GLMakie       # if plotting with GLMakie desired
        add SignalTablesInterface_WGLMakie      # if plotting with WGLMakie desired
        add SignalTablesInterface_CairoMakie    # if plotting with CairoMakie desired
If you have trouble installing SignalTablesInterface_PyPlot, see
Installation of PyPlot.jl
Main developer
Martin Otter, DLR - Institute of System Dynamics and Control