Choropleth example Covid rate of infection in Portugal
First, download the Portuguese district polygons shape file from this Github repo Next load it with:
using GMT, DataFrames, CSVPt = gmtread("C:\\programs\\compa_libs\\covid19pt\\extra\\mapas\\concelhos\\concelhos.shp");Download and load a CSV file from same repo with rate of infection per district. Load it into a DataFrame to simplify data extraction.
incidence = CSV.read("C:\\programs\\compa_libs\\covid19pt\\data_concelhos_incidencia.csv", DataFrame);Get the rate of incidence in number of infected per 100_000 habitants for the last reported week.
r = collect(incidence[end, 2:end]);But the damn polygon names above are all uppercase, Ghrrr. We will have to take care of that.
ids = names(incidence)[2:end];Because the multi-segment headers have several fields in a comma separated string and the one we care (the one that is common with the names in the Pt dataset) is in the seventh position we use argument 7. Last argument, 2 means to convert all names in the Pt headers to upper case so we can compare them with the names in ids. The comparison is made inside the next call to the $make\_zvals\_vec()$ function that takes care to return the numerical vector that we need in plot'slevel option
zvals = GMT.make_zvals_vec(Pt, ids, r, 7, 2);Create a Colormap to paint the district polygons
C = makecpt(range=(0,1500,10), inverse=true, cmap=:oleron, hinge=240, bg=:o);Get the date for the data being represented to use in title
date = incidence[end,1];And finaly do the plot
plot(Pt, level=zvals, cmap=C, close=true, fill="+z", pen=0.5, region=(-9.75,-5.9,36.9,42.1), proj=:Mercator, title="Infected / 100.000 habitants " * date)colorbar!(pos=(anchor=:MR,length=(12,0.6), offset=(-2.4,-4)), color=C, axes=(annot=100,), show=true)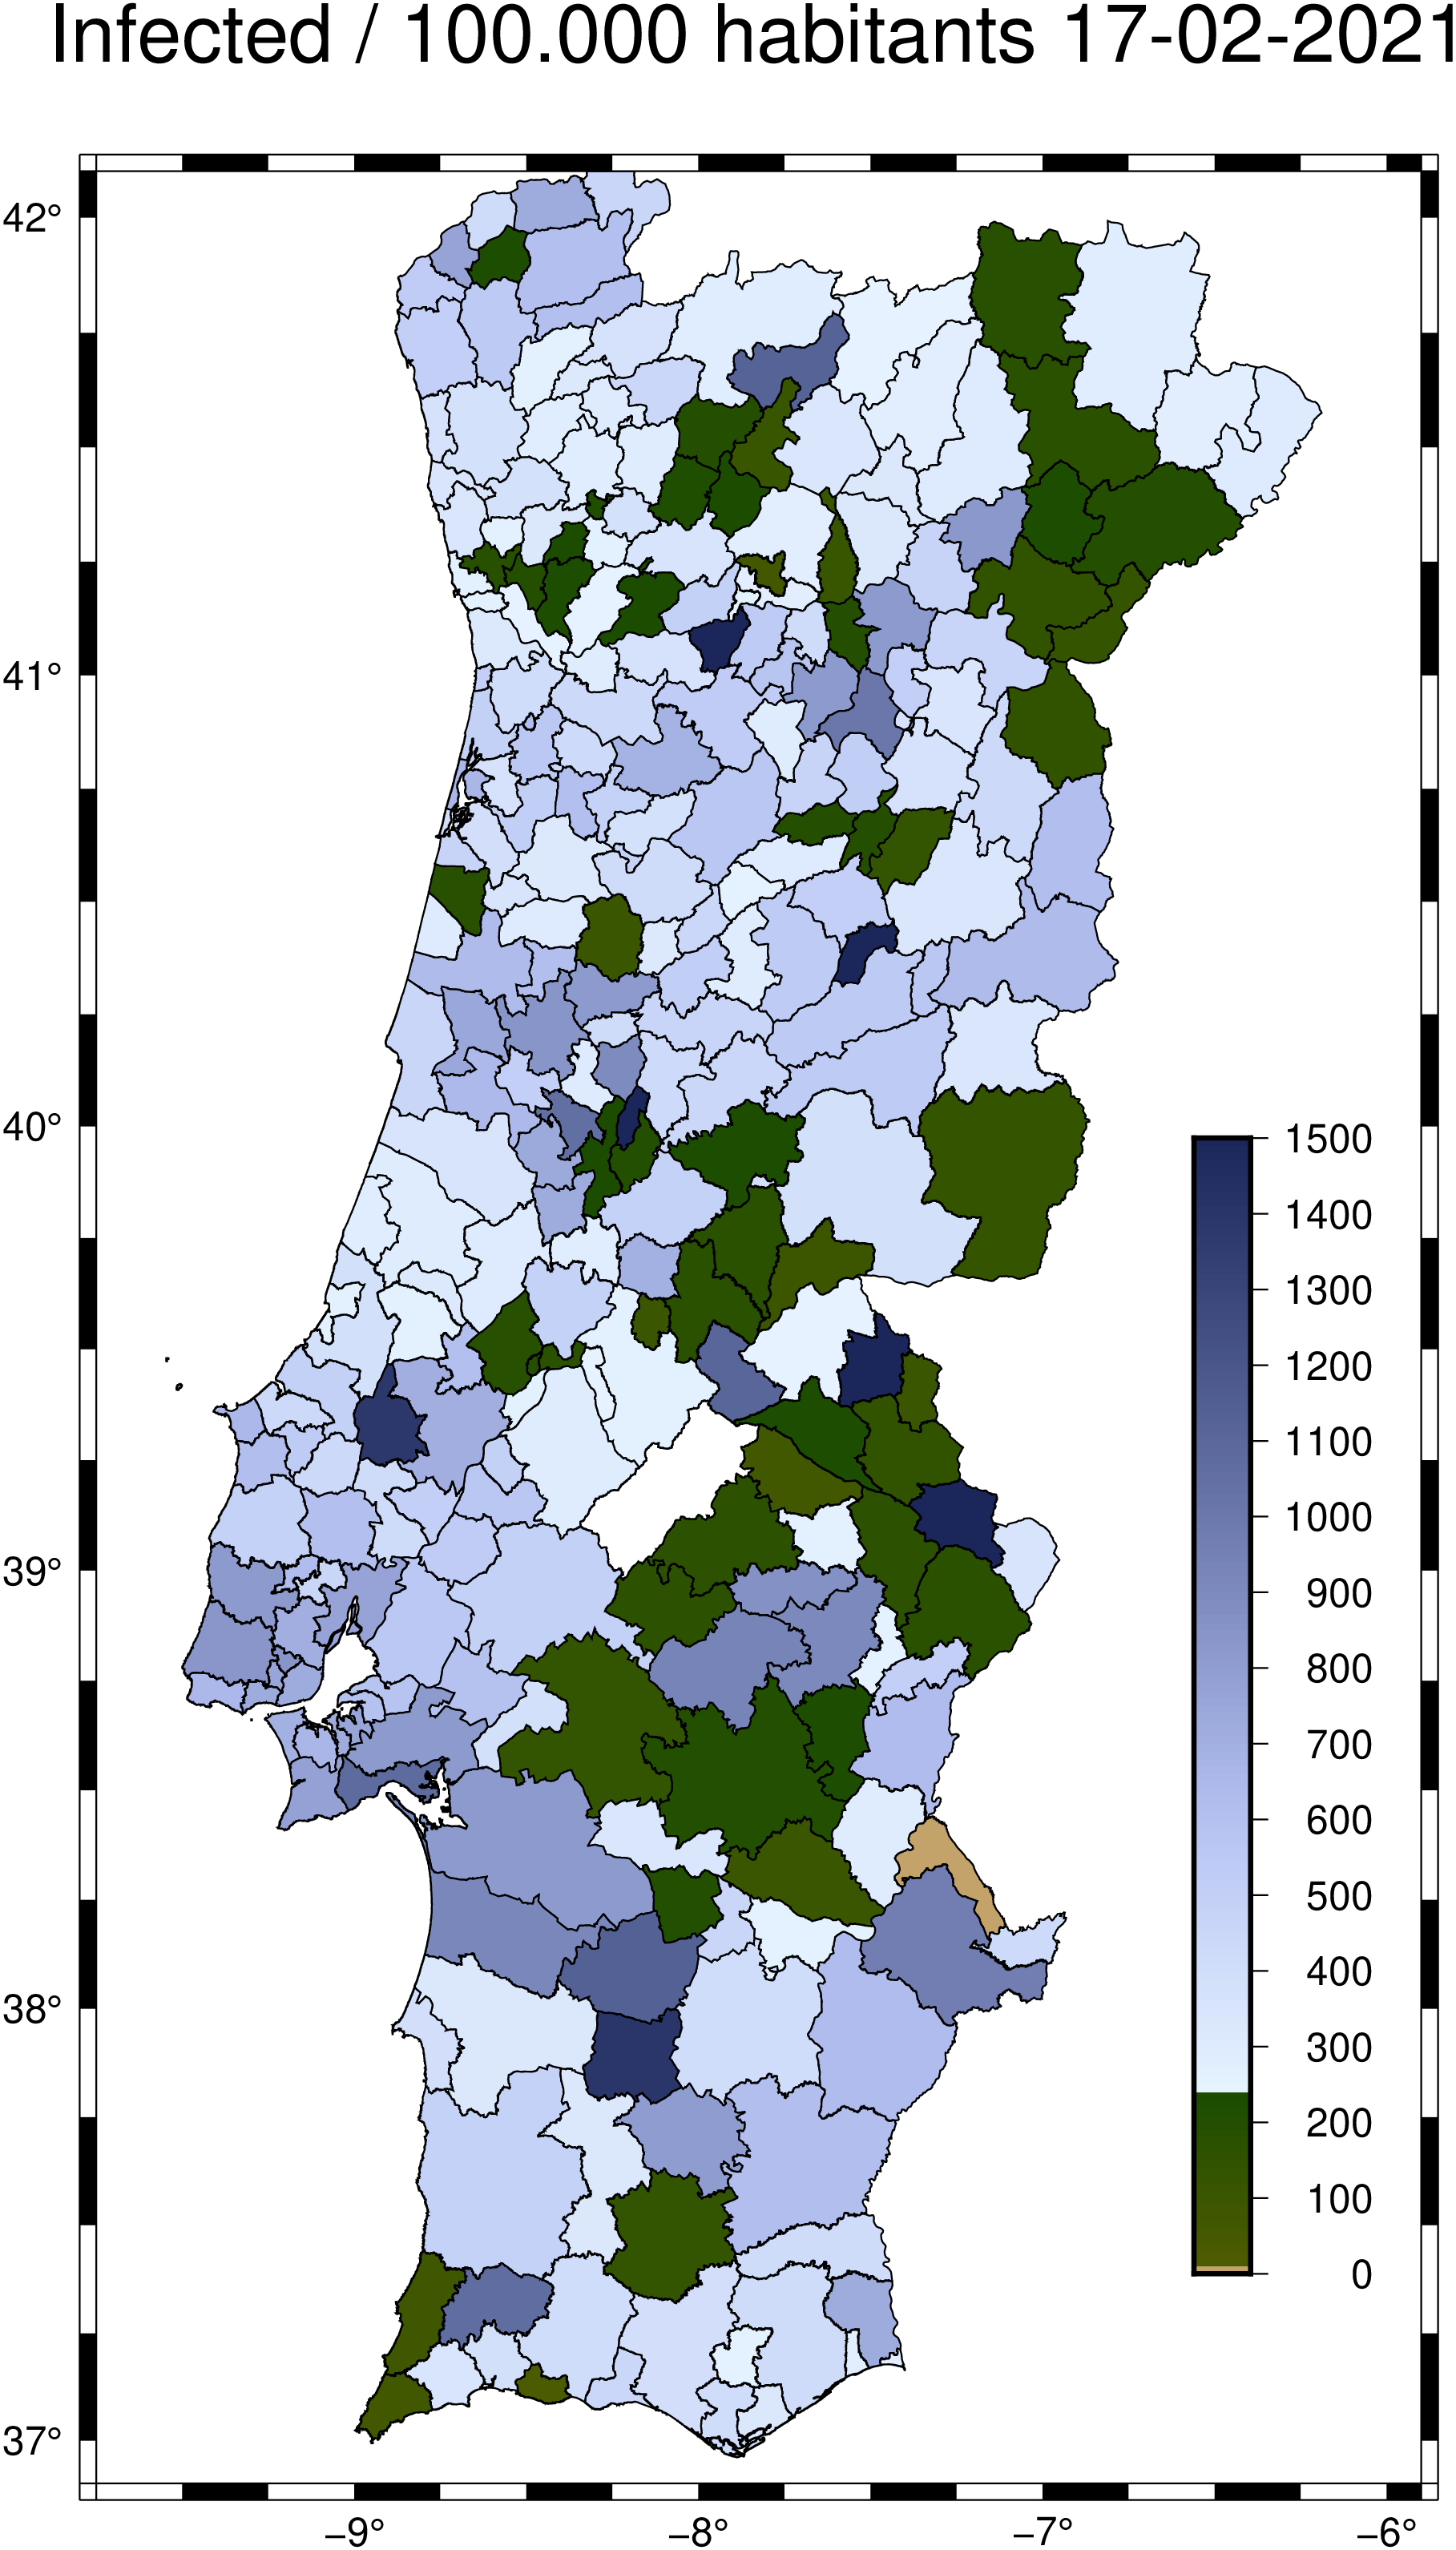
Download a Pluto Notebook here