Ploting functions
There are a couple of predefined functions that can plotted for demonstration purposes. For example the ackley function
imshow("ackley", view=(159,30), shade=true)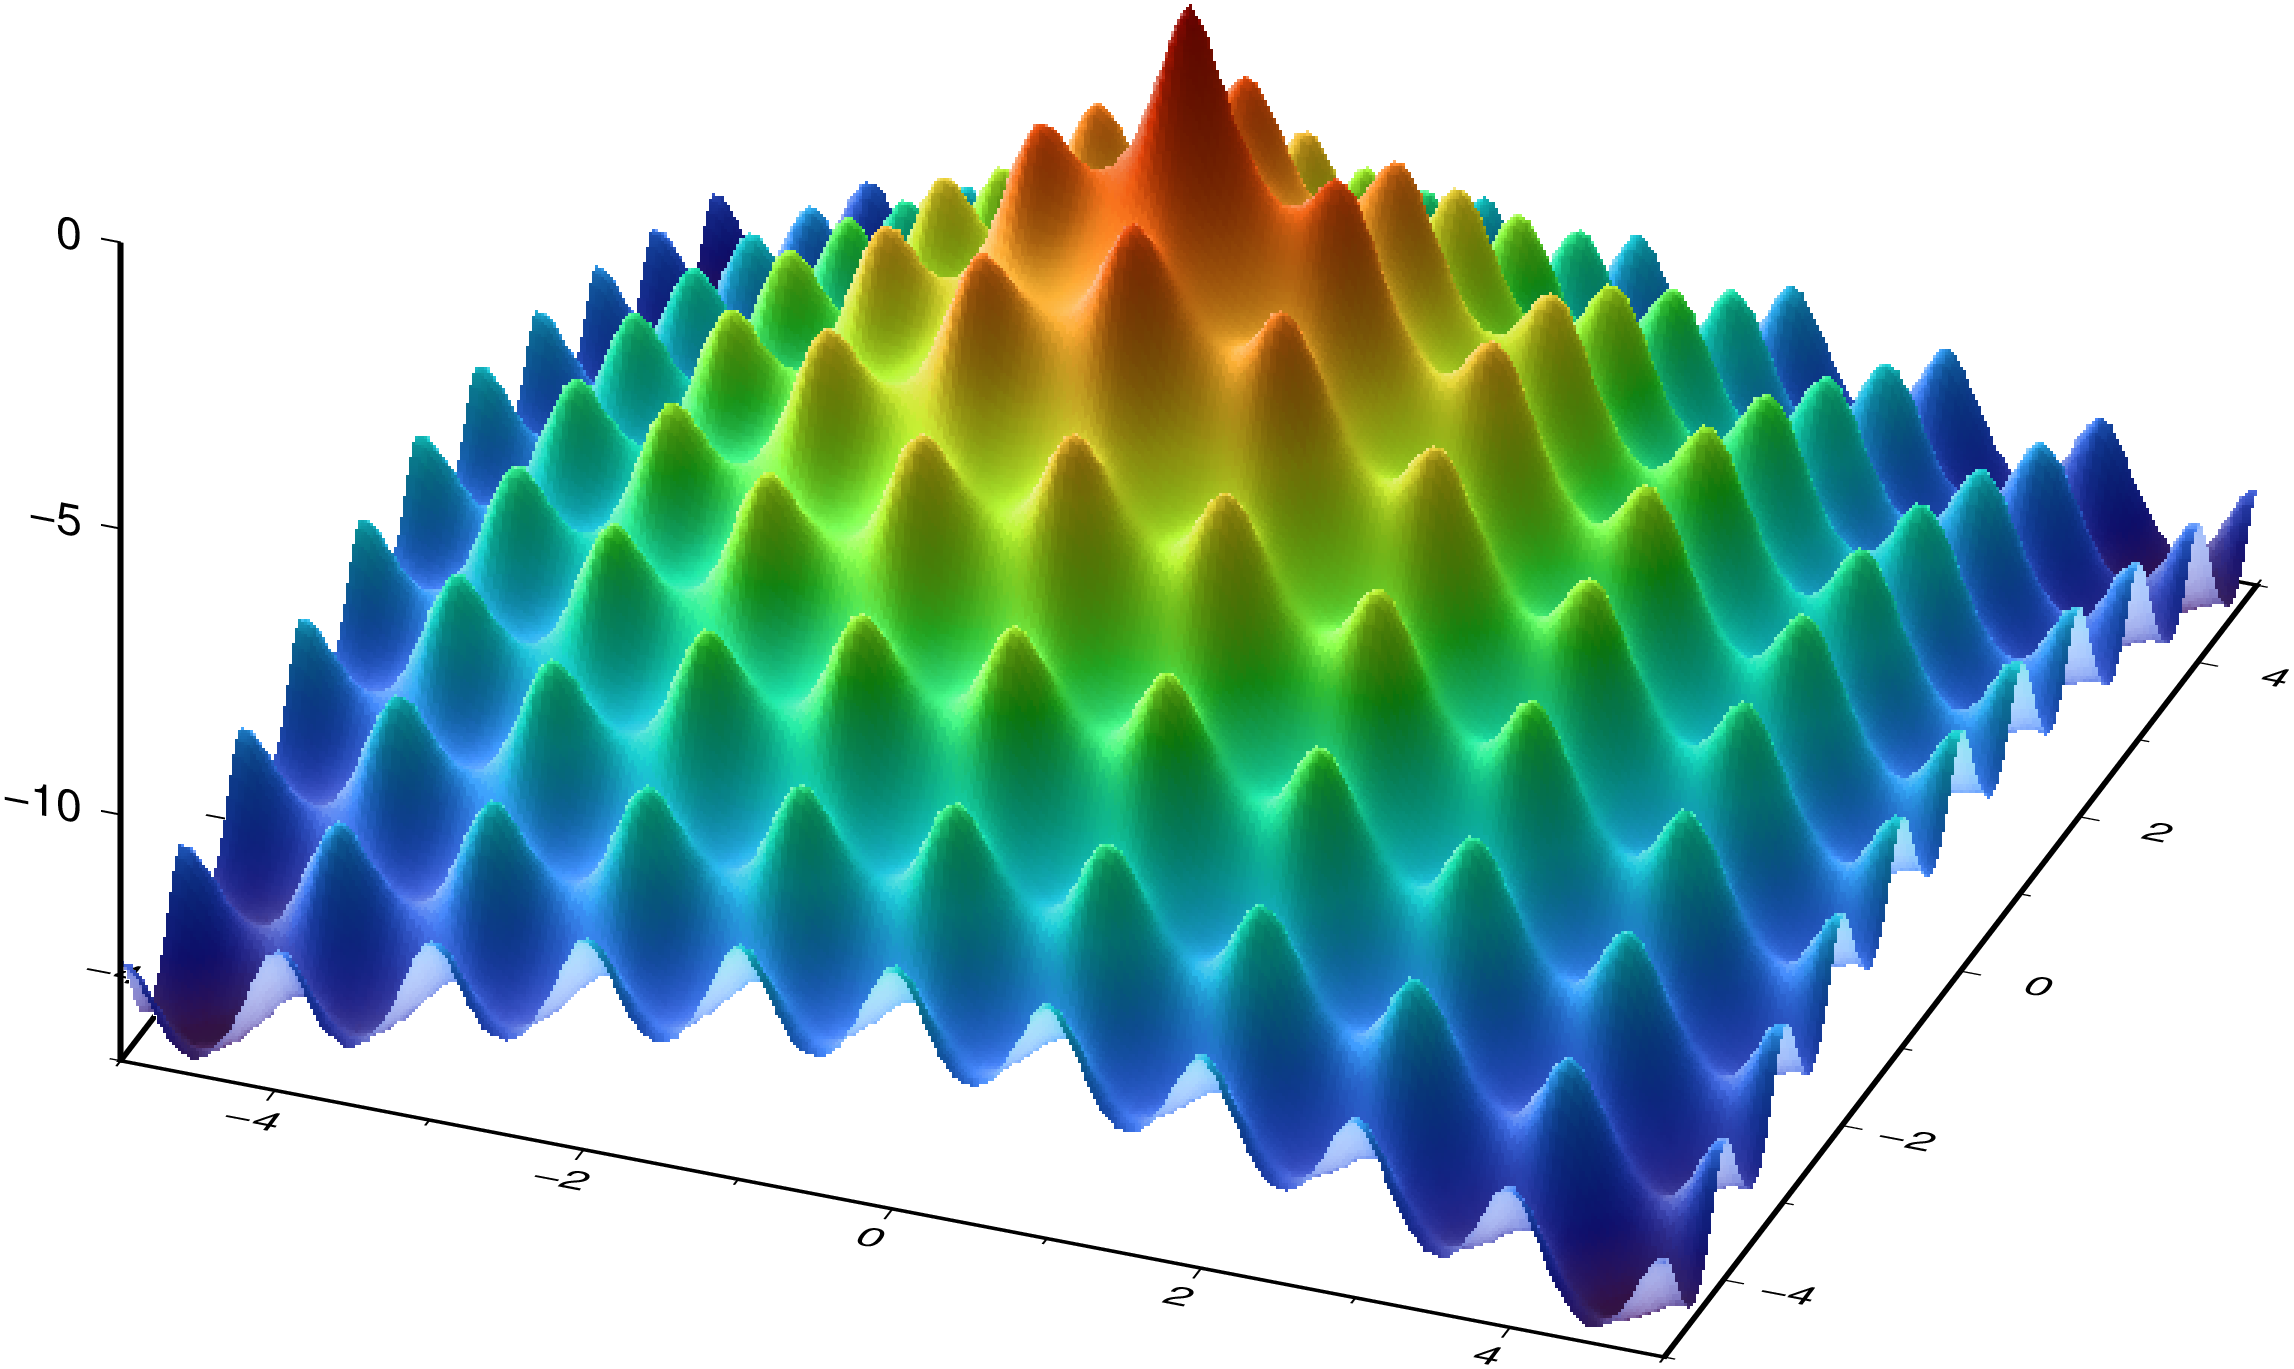
Or the rosenbrock that looks like a manta ray (other options are parabola, eggbox, sombrero)"
imshow("rosenbrock", view=(159,30), shade=true)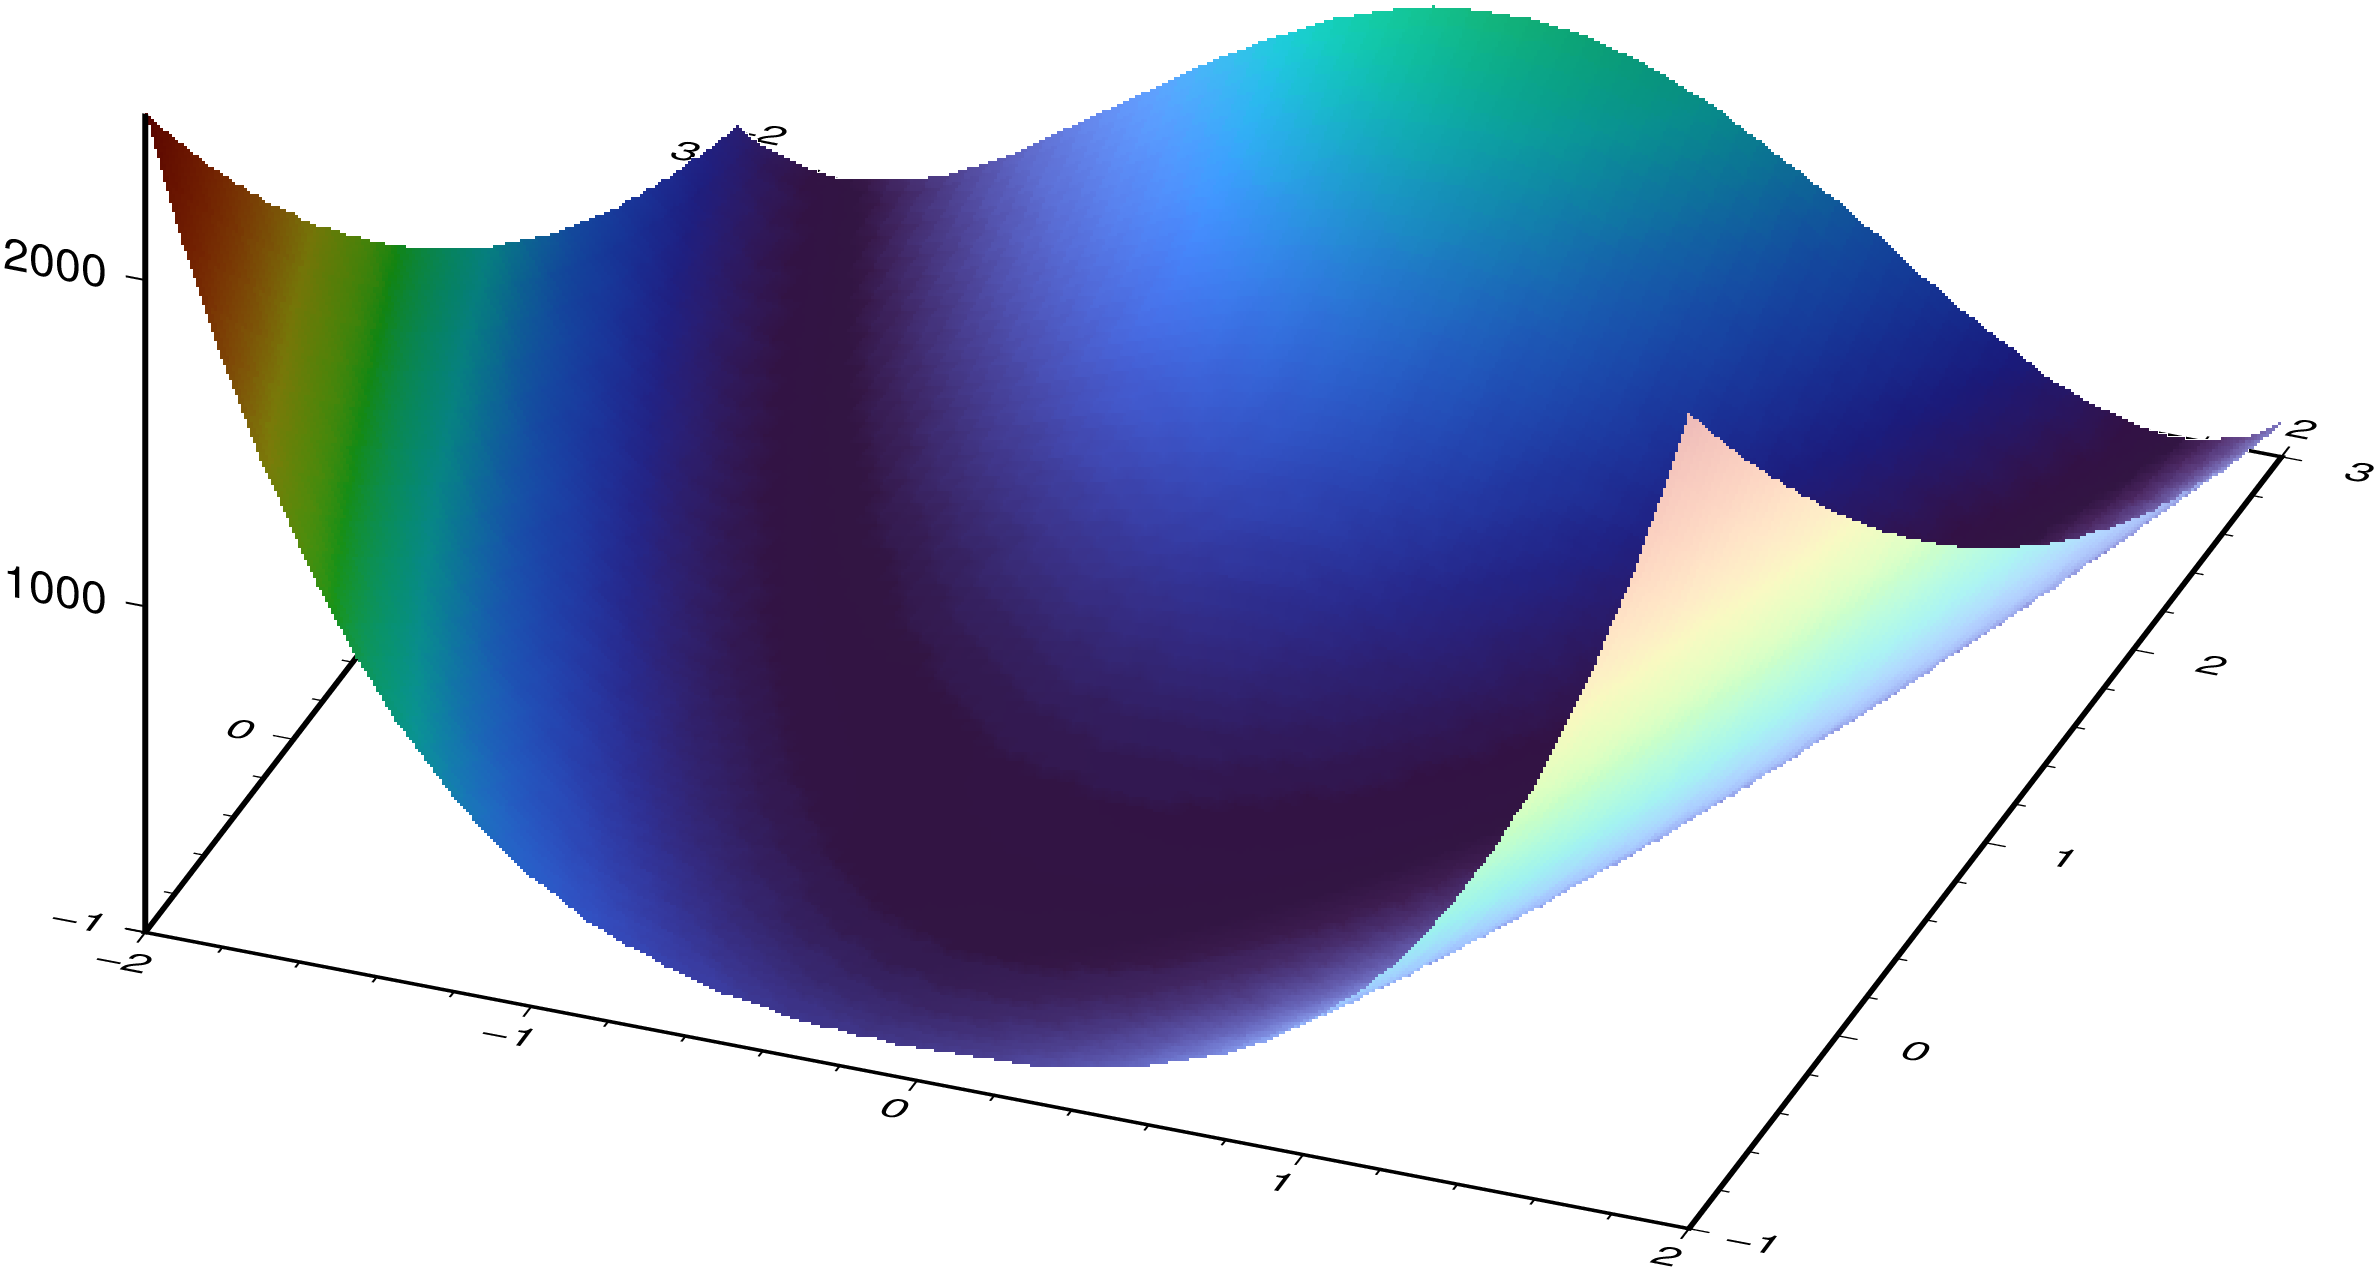
But besides these predefined functions one can any function that defines a surface. For example a parabola can be plotted with the code bellow. First argument can be an anonymous function (like the example) of a function. Second and third args contain the plotting domain and step used to evaluate the function.
imshow((x,y) -> sqrt(x^2 + y^2), -5:0.05:5, -5:0.05:5, view=(159,30), shade=true, frame=:autoXYZg)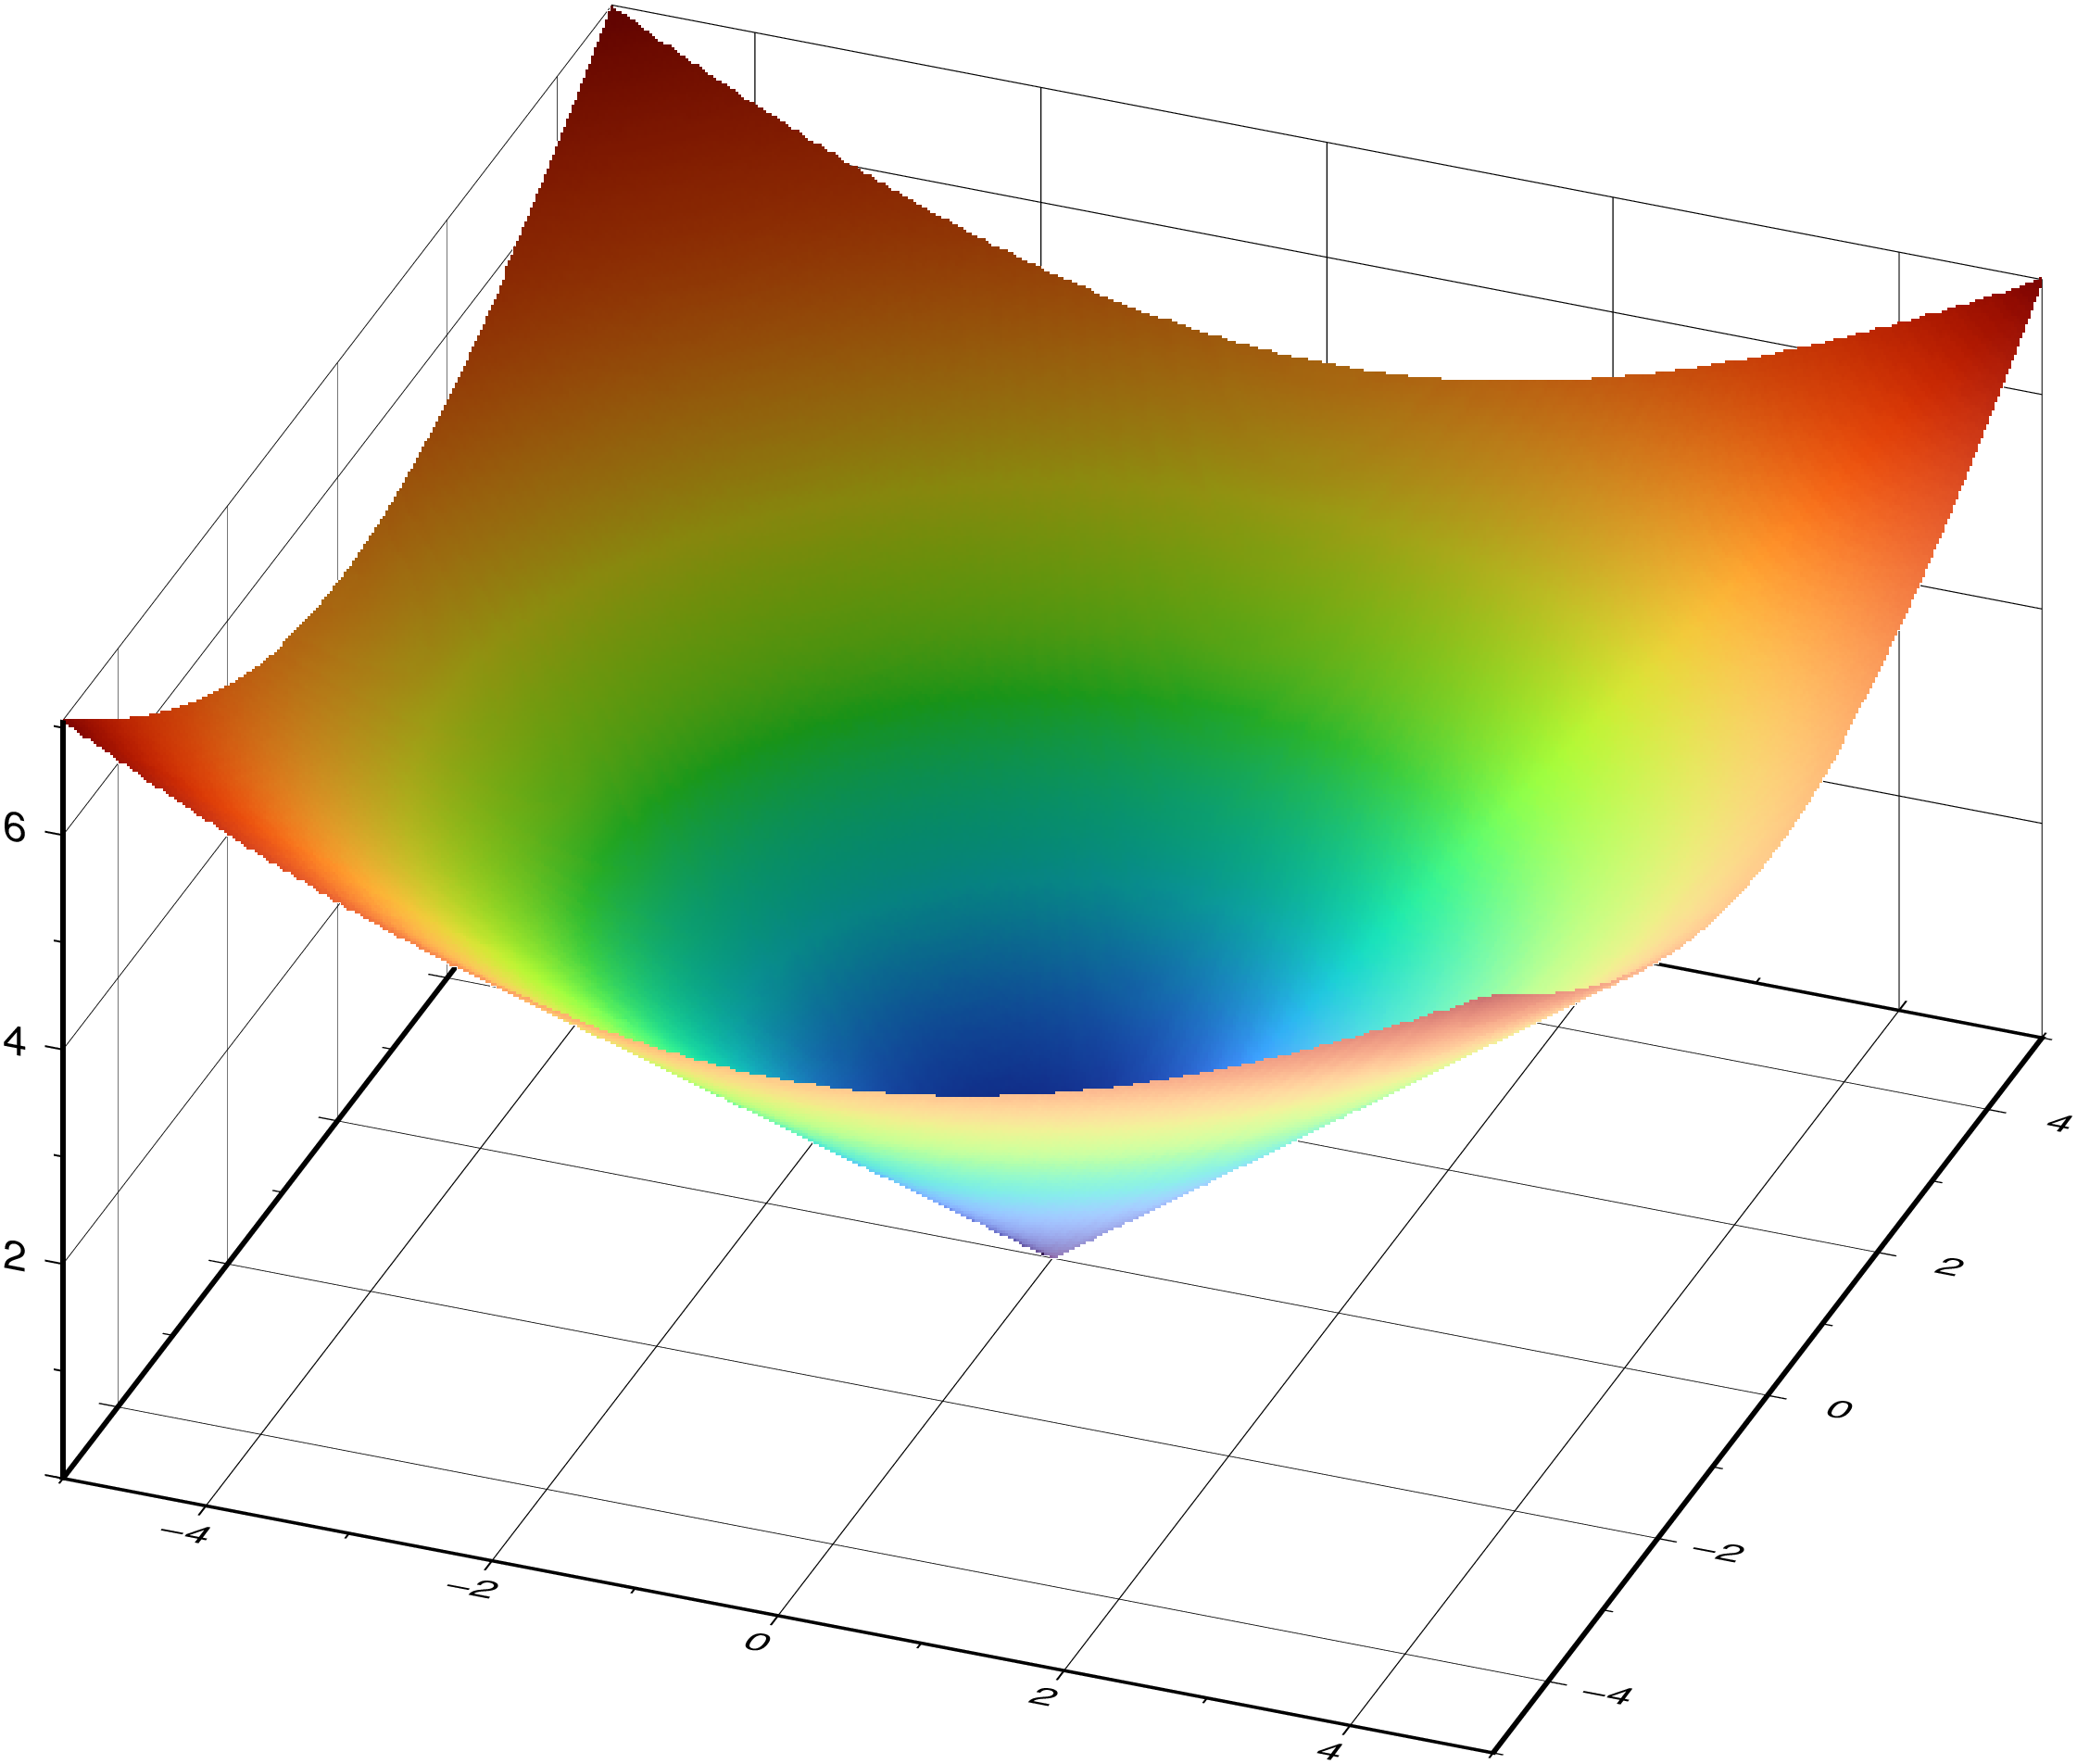
And we can plot 3D lines too. Same thing, give a parametric equation and
plot3d(x -> sin(x)*cos(10x), y -> sin(y)*sin(10y), z -> cos(z), 0:pi/200:pi, lt=2, lc=:brown, frame=:autoXYZg, show=true)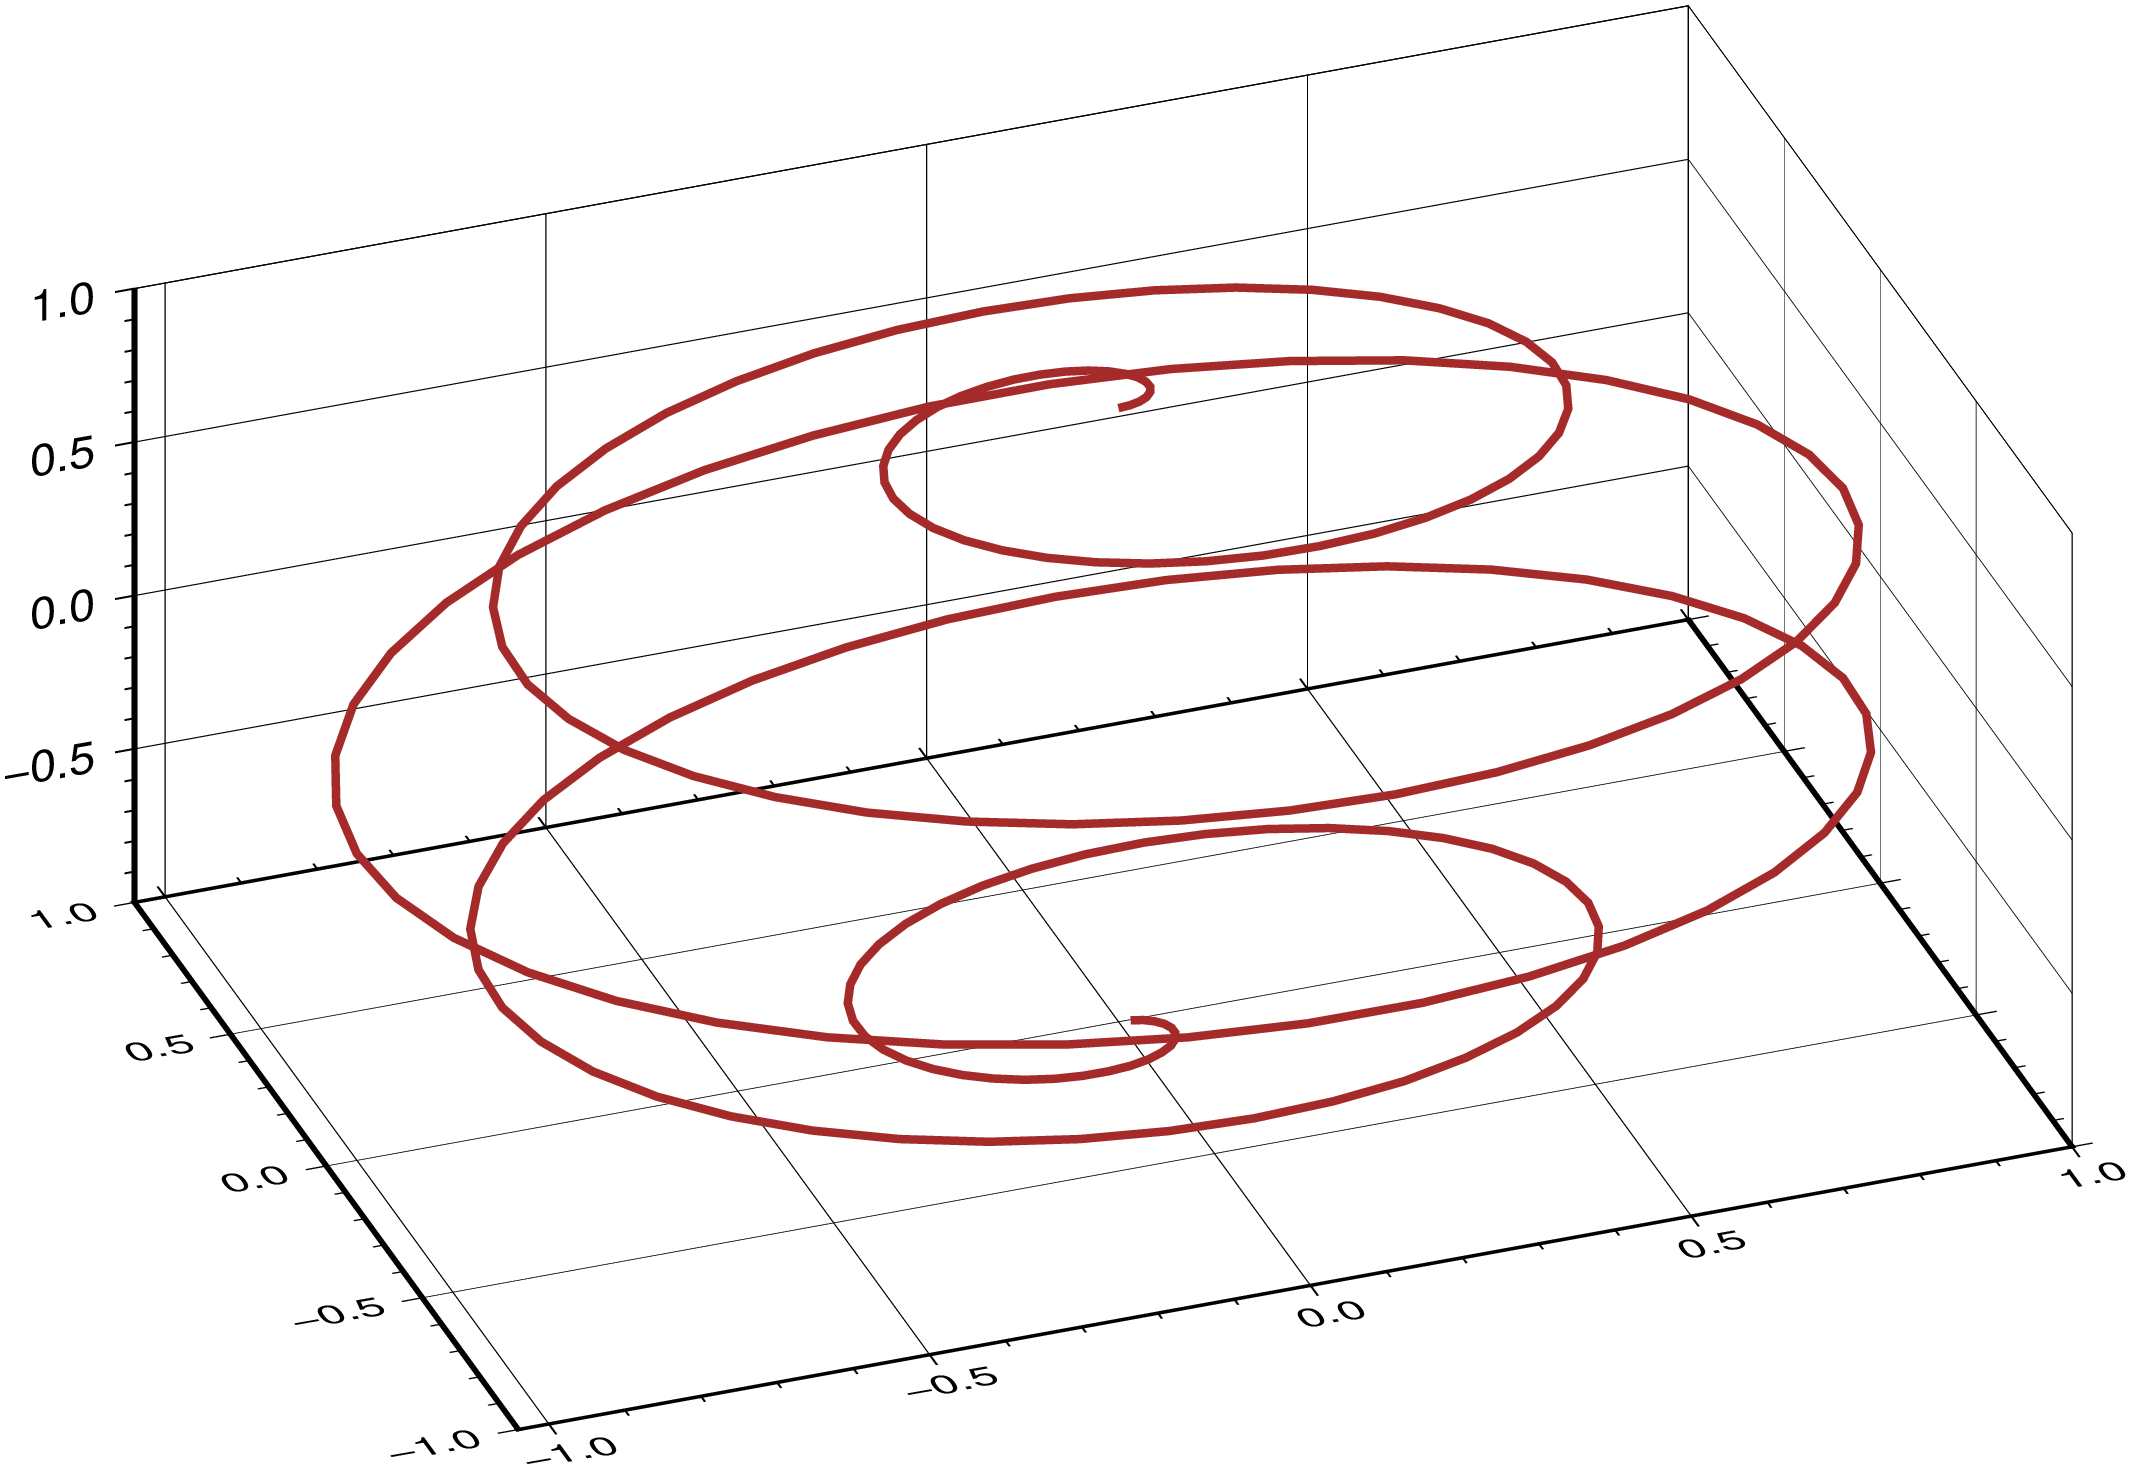
And a 2D example
lines(x -> cos(x) * x, y -> sin(y) * y, linspace(0,2.1pi,100), region=(-4,7,-5.5,2.5),
	lw=2, lc=:sienna, decorated=(quoted=true, const_label=" I am the center of the Universe", font=(34,"Times-Italic"), curved=true), aspect=:equal, show=true)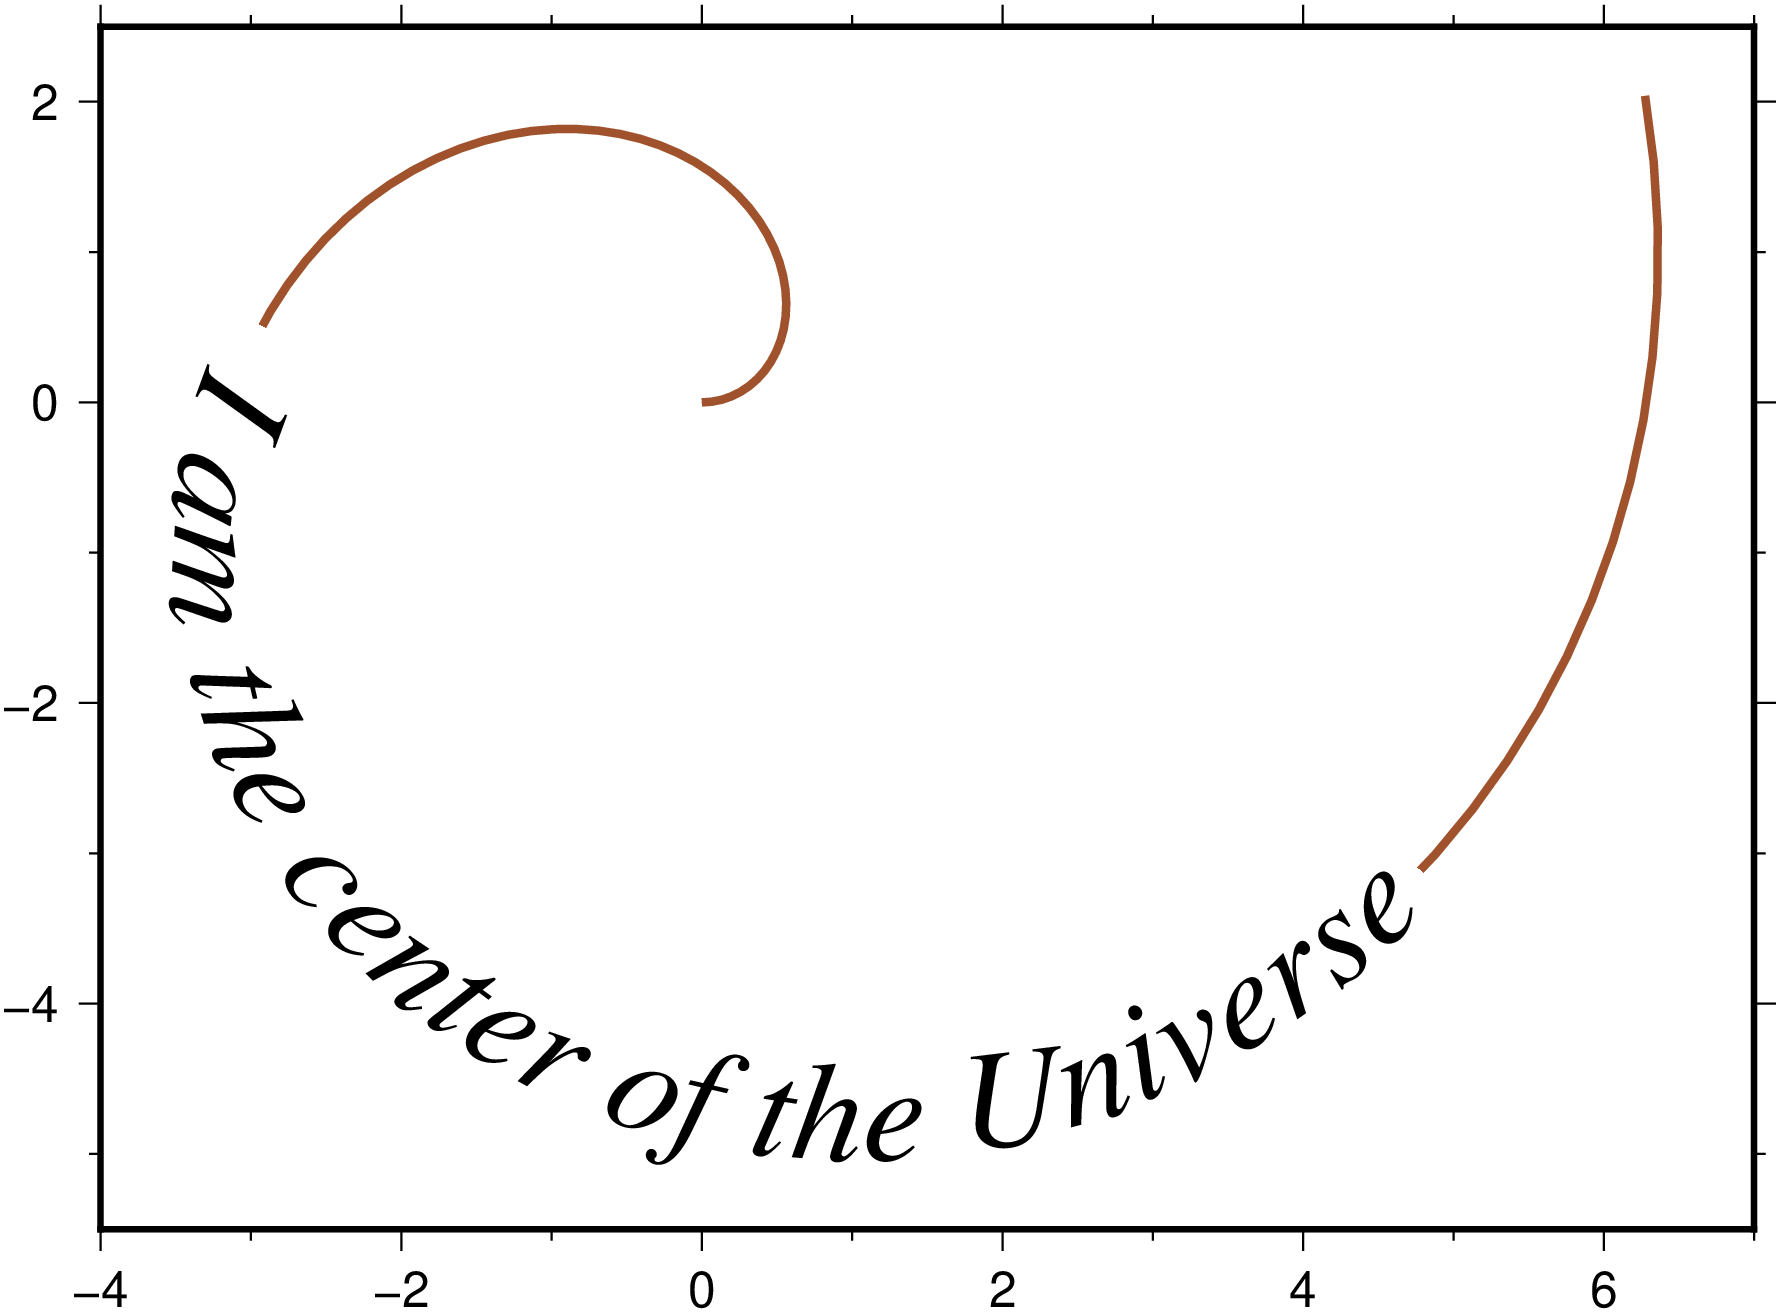
Download a Pluto Notebook here