Advanced: Debugging
There are many handy tools implemented in ADCME for analysis, benchmarking, input/output, etc.
Debugging and Printing
Add the following line before Session and change tf.Session to see verbose printing (such as GPU/CPU information)
tf.debugging.set_log_device_placement(true)tf.print can be used for printing tensor values. It must be binded with an executive operator.
# a, b are tensors, and b is executive
op = tf.print(a)
b = bind(b, op)
Debugging Python Codes
If the error comes from Python (through PyCall), we can print out the Python trace with the following commands
import traceback
try:
    # Your codes here
except Exception:
    print(traceback.format_exc())
This Python script can be inserted to Julia and use interpolation to invoke Julia functions (in the comment line).
As an application, we can use this trick to debug "NotFoundError" for custom operators
using ADCME, PyCall
py"""
import tensorflow as tf
import traceback
try:
    tf.load_op_library("../libMyOp.so")
except Exception:
    print(traceback.format_exc())
"""
Profiling
Profiling can be done with the help of run_profile and save_profile
a = normal(2000, 5000)
b = normal(5000, 1000)
res = a*b
run_profile(sess, res)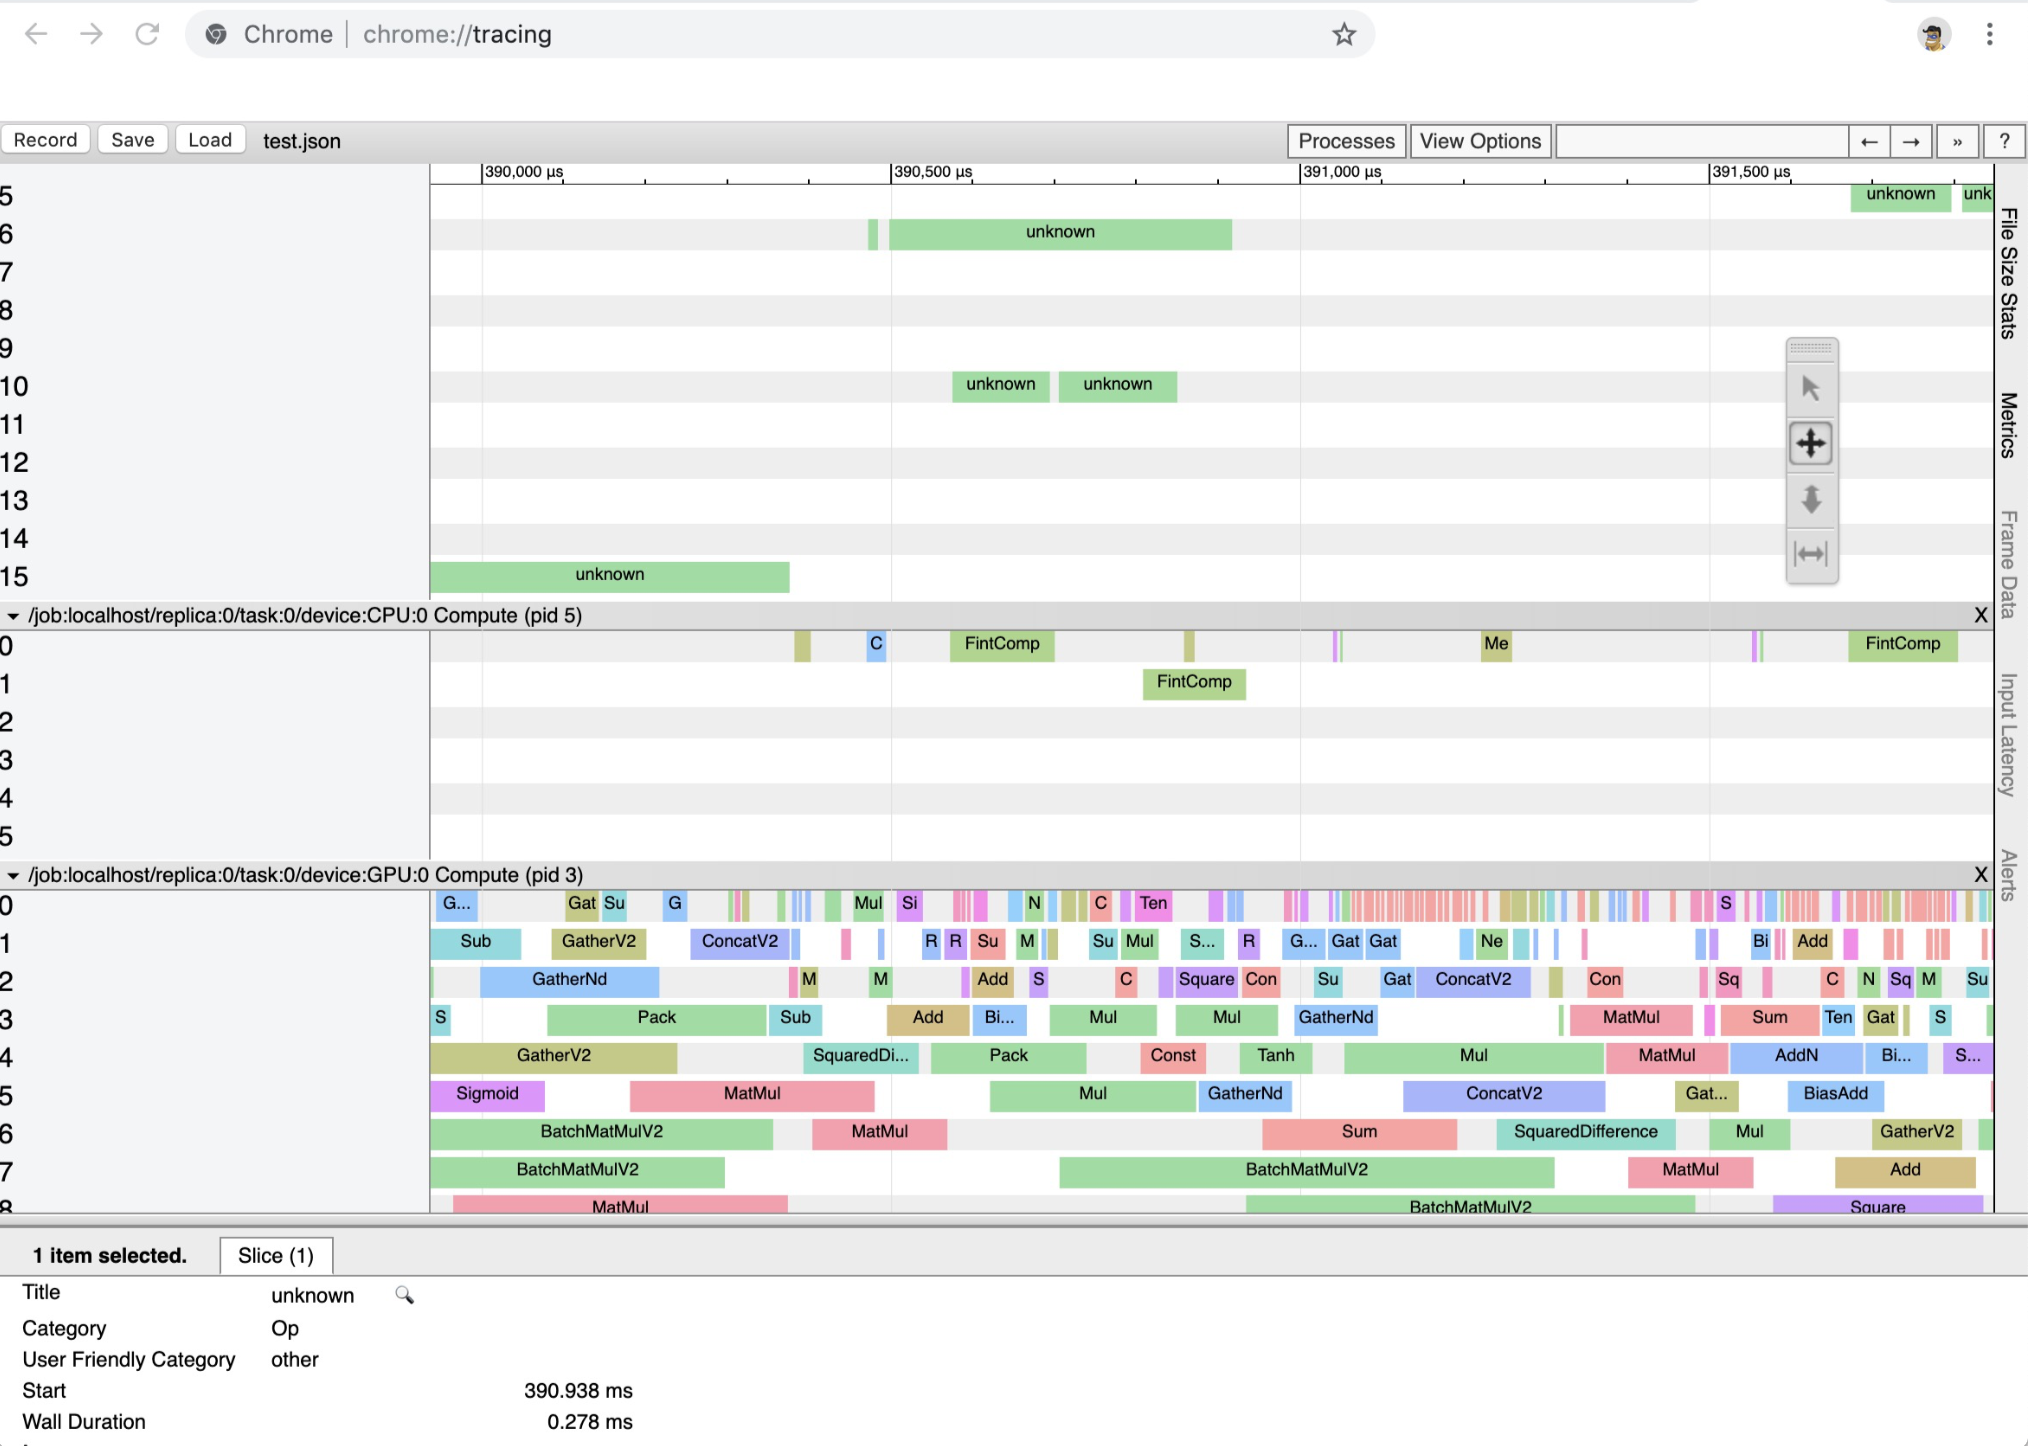
save_profile("test.json")- Open Chrome and navigate to chrome://tracing
- Load the timeline file
Below shows an example of profiling results.
Save and Load Diary
We can use TensorBoard to track a scalar value easily
d = Diary("test")
p = placeholder(1.0, dtype=Float64)
b = constant(1.0)+p
s = scalar(b, "variable")
for i = 1:100
    write(d, i, run(sess, s, Dict(p=>Float64(i))))
end
activate(d)