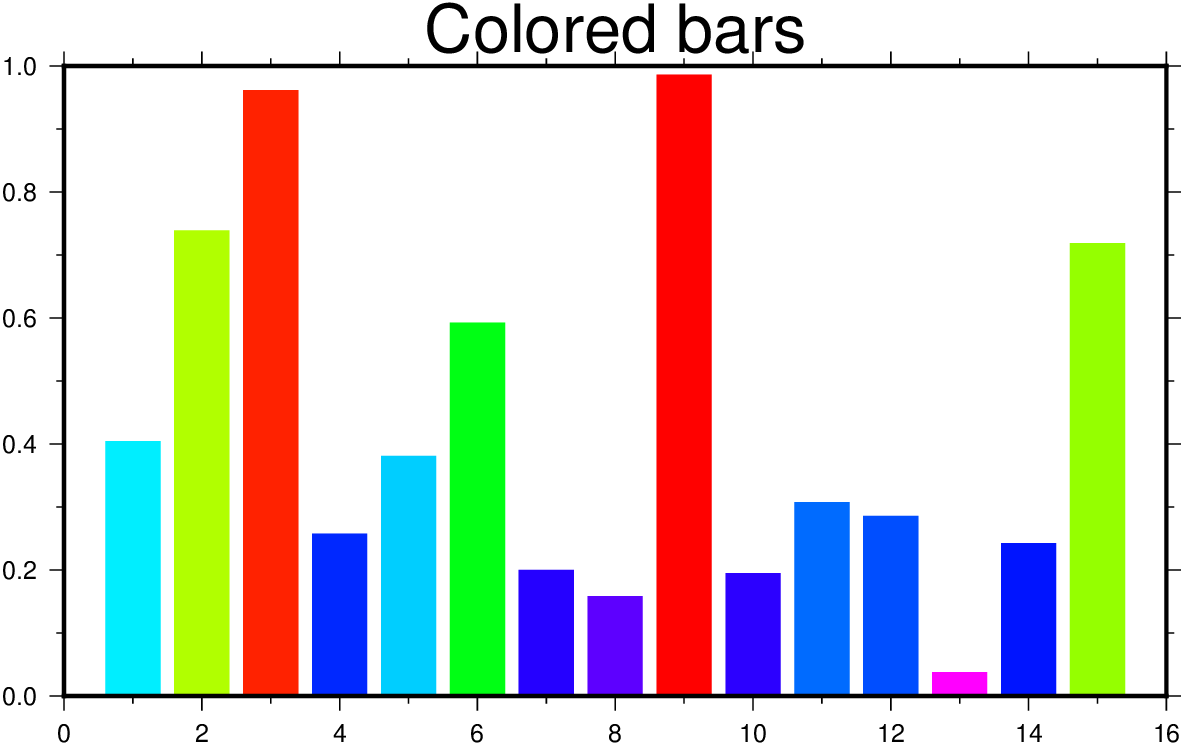
Make a bar plot where colors are proportional to bar height
bar(rand(15),              # Generate the dataset
    color=:rainbow,        # The color scale
    figsize=(14,8),        # The fig size (14 x 8 cm)
    title="Colored bars",  # The fig title
    fmt=:png,              # The image format
    show=true)             # Show the result
As a one-liner (to facilitate copy-paste):
bar(rand(15), color=:rainbow, figsize=(14,8), title="Colored bars", fmt=:png, show=true)