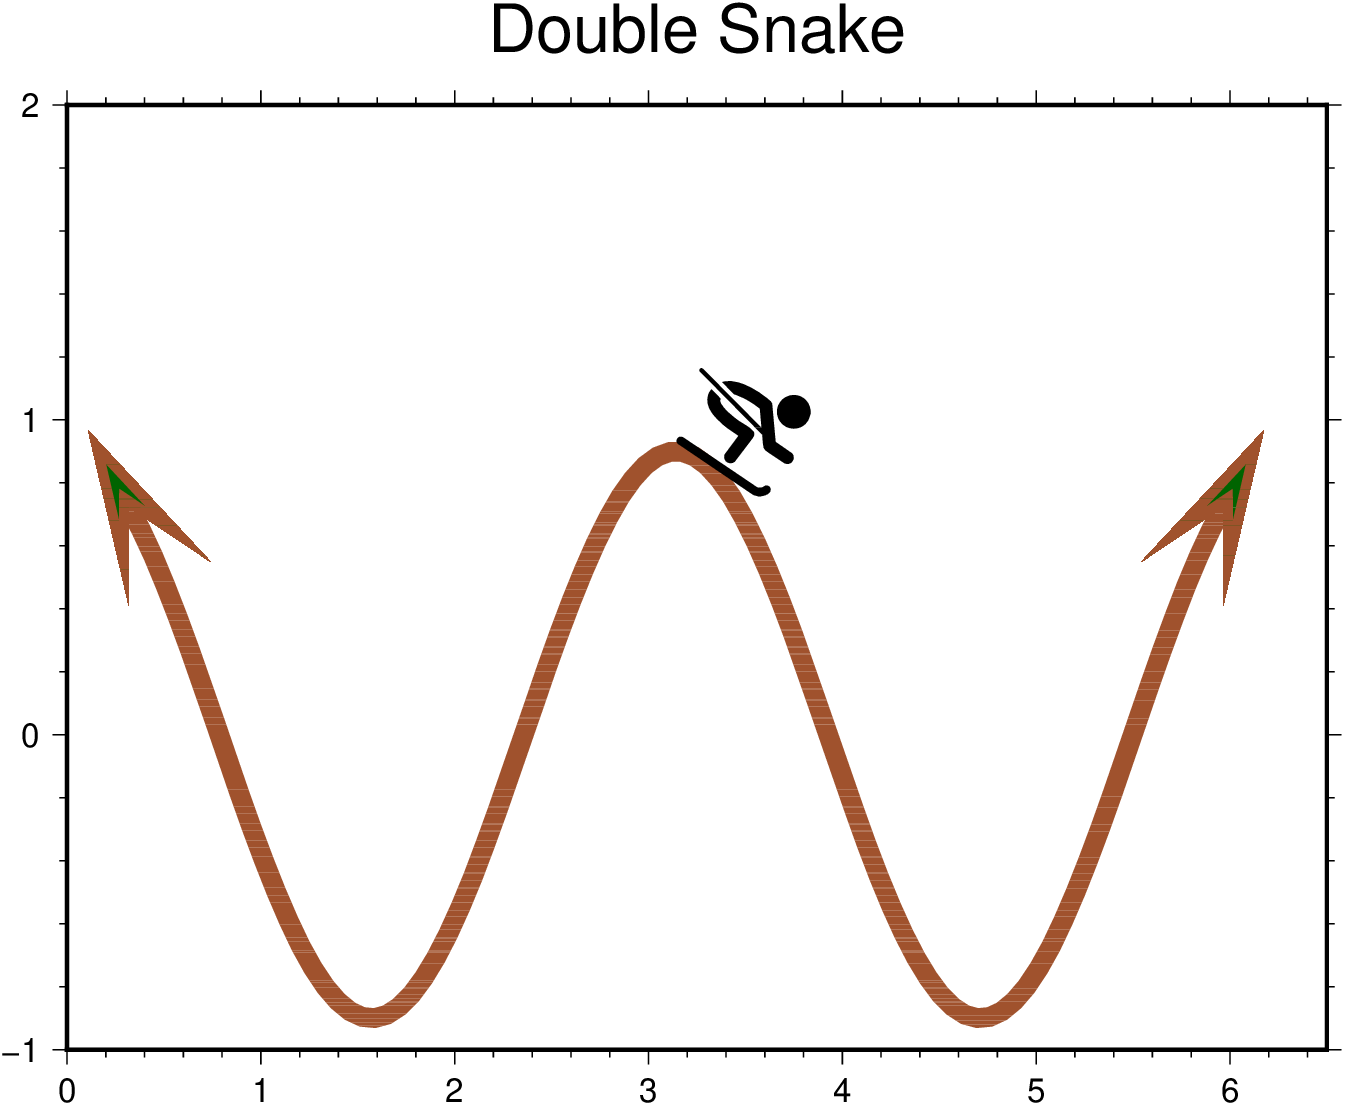
The snake skier
Plot a skier on sinusoid. To run this script one need to have the symbol file "ski_alpine.eps"
x = GMT.linspace(0, 2pi);  y = cos.(2x)*0.9;

lines(x,y,                           # The data
      limits=(0,6.5,-1,2.0),         # Fig limits
      pen=(lw=7,lc=:sienna, arrow=(len=2.2,shape=:arrow, fill=:darkgreen)),  # The "Snake"
      figsize=(16,12),               # Fig size
      title="Double Snake")
plot!(3.49, 0.97,                    # Coordinates where to plot symbol
      symbol="kski_alpine/1.7",      # Fill patern file
      fill=:black),                  # Fill the symbol in black
      fmt=:png,                      # The image format
      show=true)                     # Show the result
As one-liners (to facilitate copy-paste):
x = GMT.linspace(0, 2pi);  y = cos.(2x)*0.9;
lines(x,y, limits=(0,6.5,-1,2.0), figsize=(16,12), pen=(lw=7,lc=:sienna, arrow=(len=2.2,shape=:arrow, fill=:darkgreen)), title="Double Snake")
plot!(3.49, 0.97, symbol="kski_alpine/1.7", fill=:black, show=true, fmt=:png)