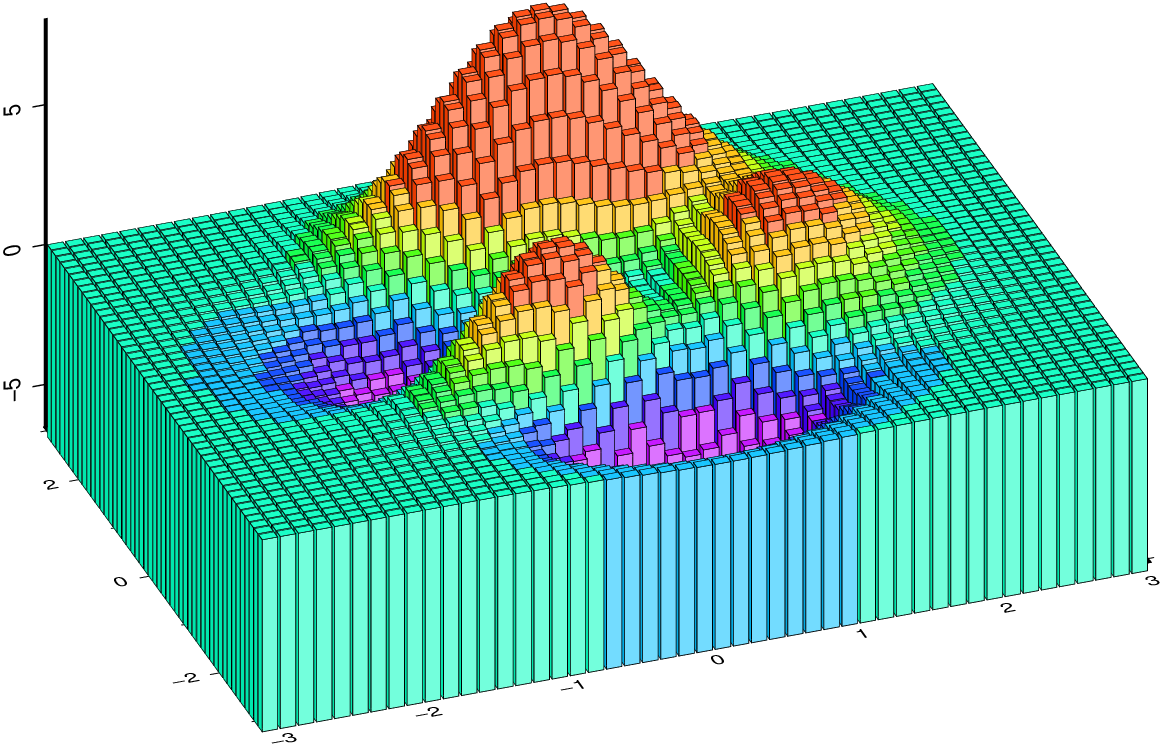
Make a 3D bar plot with colors in function of bar's height
Create a 'peaks' grid
G = GMT.peaks();      # The grid
cmap = grd2cpt(G);    # Colormap with the grid's data range
Plot that grid as 3D prisms. Here we use the default fig width of 12 cm
bar3(G,               # 'G' is the grid created above
     lw=:thinnest,    # Line thickness (0.25 pt)
     color=cmap,      # Paint the prisms with colormap computed from grid
     fmt=:png,        # The image format
     show=true)       # Show the result
As one-liners (to facilitate copy-paste):
G = GMT.peaks();    cmap = grd2cpt(G);
bar3(G, lw=:thinnest, color=cmap, fmt=:png, show=true)