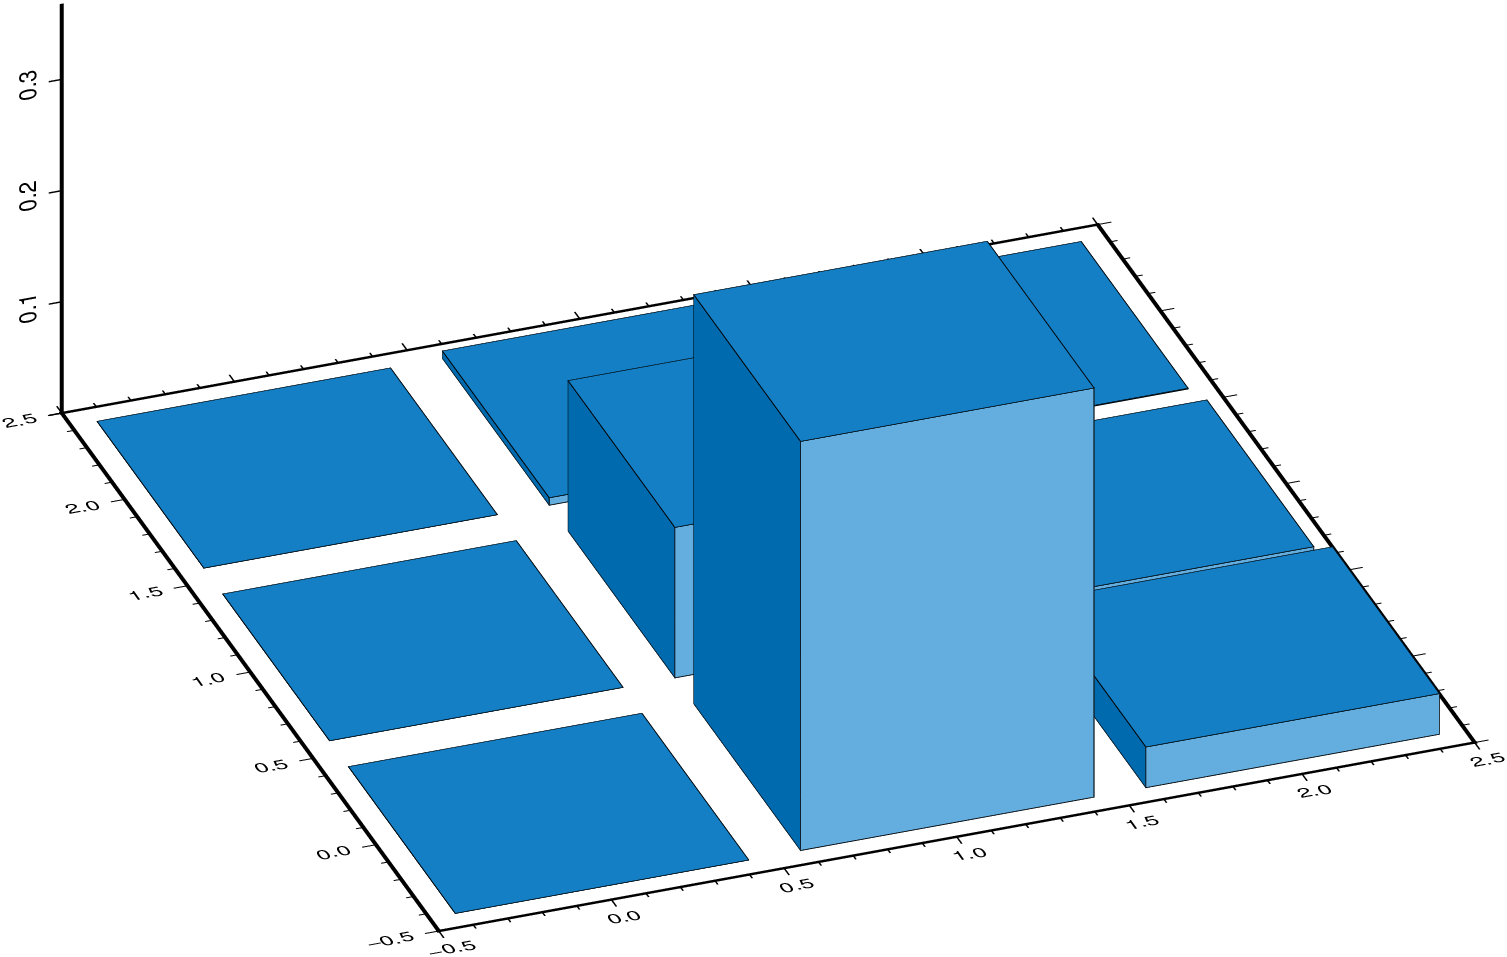
Make a 3D bar plot with constant color
Create a 3x3 grid
G = gmt("grdmath -R0/2/0/2 -I1 X Y R2 NEG EXP X MUL =");Plot that grid as 3D prisms
bar3(G,                 # 'G' is the grid created above
     fill=[0,115,190],  # Fill prisms with this RGB color
     lw=:thinnest,      # Line thickness (0.25 pt)
     figsize=14,        # Set fig width of 14 cm
     fmt=:png,          # The image format
     show=true)         # Show the result
As one-liners (to facilitate copy-paste):
G = gmt("grdmath -R0/2/0/2 -I1 X Y R2 NEG EXP X MUL =");
bar3(G, fill=[0,115,190], lw=:thinnest, figsize=14, fmt=:png, show=true)