Stepped patch histogram
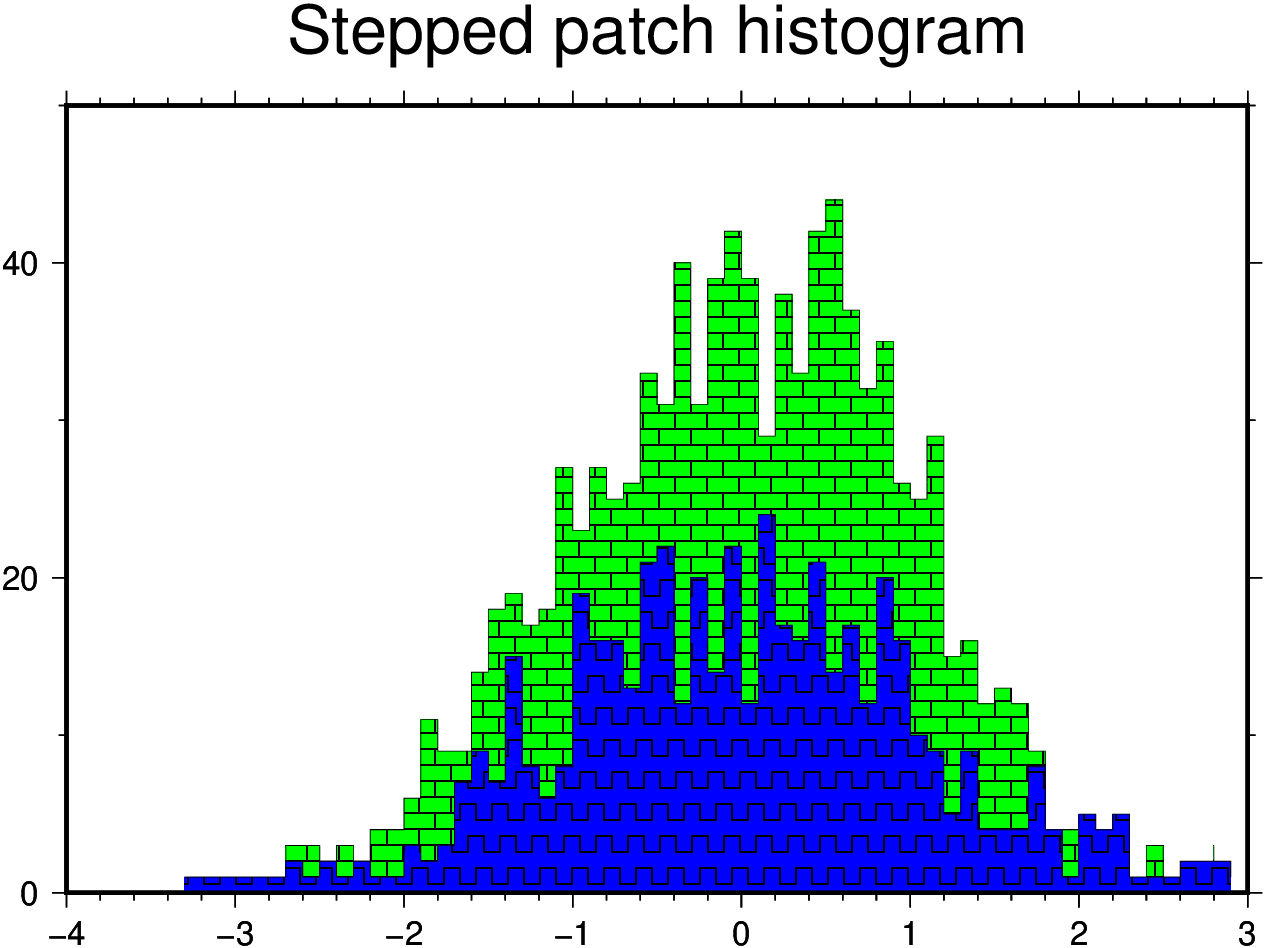
Draw a histogram as a stepped patch
D1 = histogram(randn(1000), I=:o, bin=0.1);  # Create histogrammed data with bin = 0.1 (I=:o to create the dataset)
D2 = histogram(randn(500),  I=:o, bin=0.1);

lines(D1,                    # The data
	  steps=(x=true,),       # Make steps a xx
	  close=(bot="",),       # Close polygon at the bottom
	  fill=(pattern=20, bg=:green, dpi=200),    # Set the pattern code, the background color and dpi
	  figsize=(15,10))       # Set fig size of 15x10 cm
lines!(D2,                   # Second dataset
	   steps=(x=true,),
	   close=(bot="",),
	   fill=(pattern=82,bg=:blue,dpi=100),
	   title="Stepped patch histogram",
       fmt=:png,             # The image format
       show=true)            # Show the result
As one-liners (to facilitate copy-paste):
D1 = histogram(randn(1000), I=:o, bin=0.1);
D2 = histogram(randn(500),  I=:o, bin=0.1);
lines(D1,  steps=(x=true,), close=(bot="",), fill=(pattern=20,bg=:green,dpi=200), figsize=(15,10))
lines!(D2, steps=(x=true,), close=(bot="",), fill=(pattern=82,bg=:blue,dpi=100), title="Stepped patch histogram", show=true, fmt=:png)