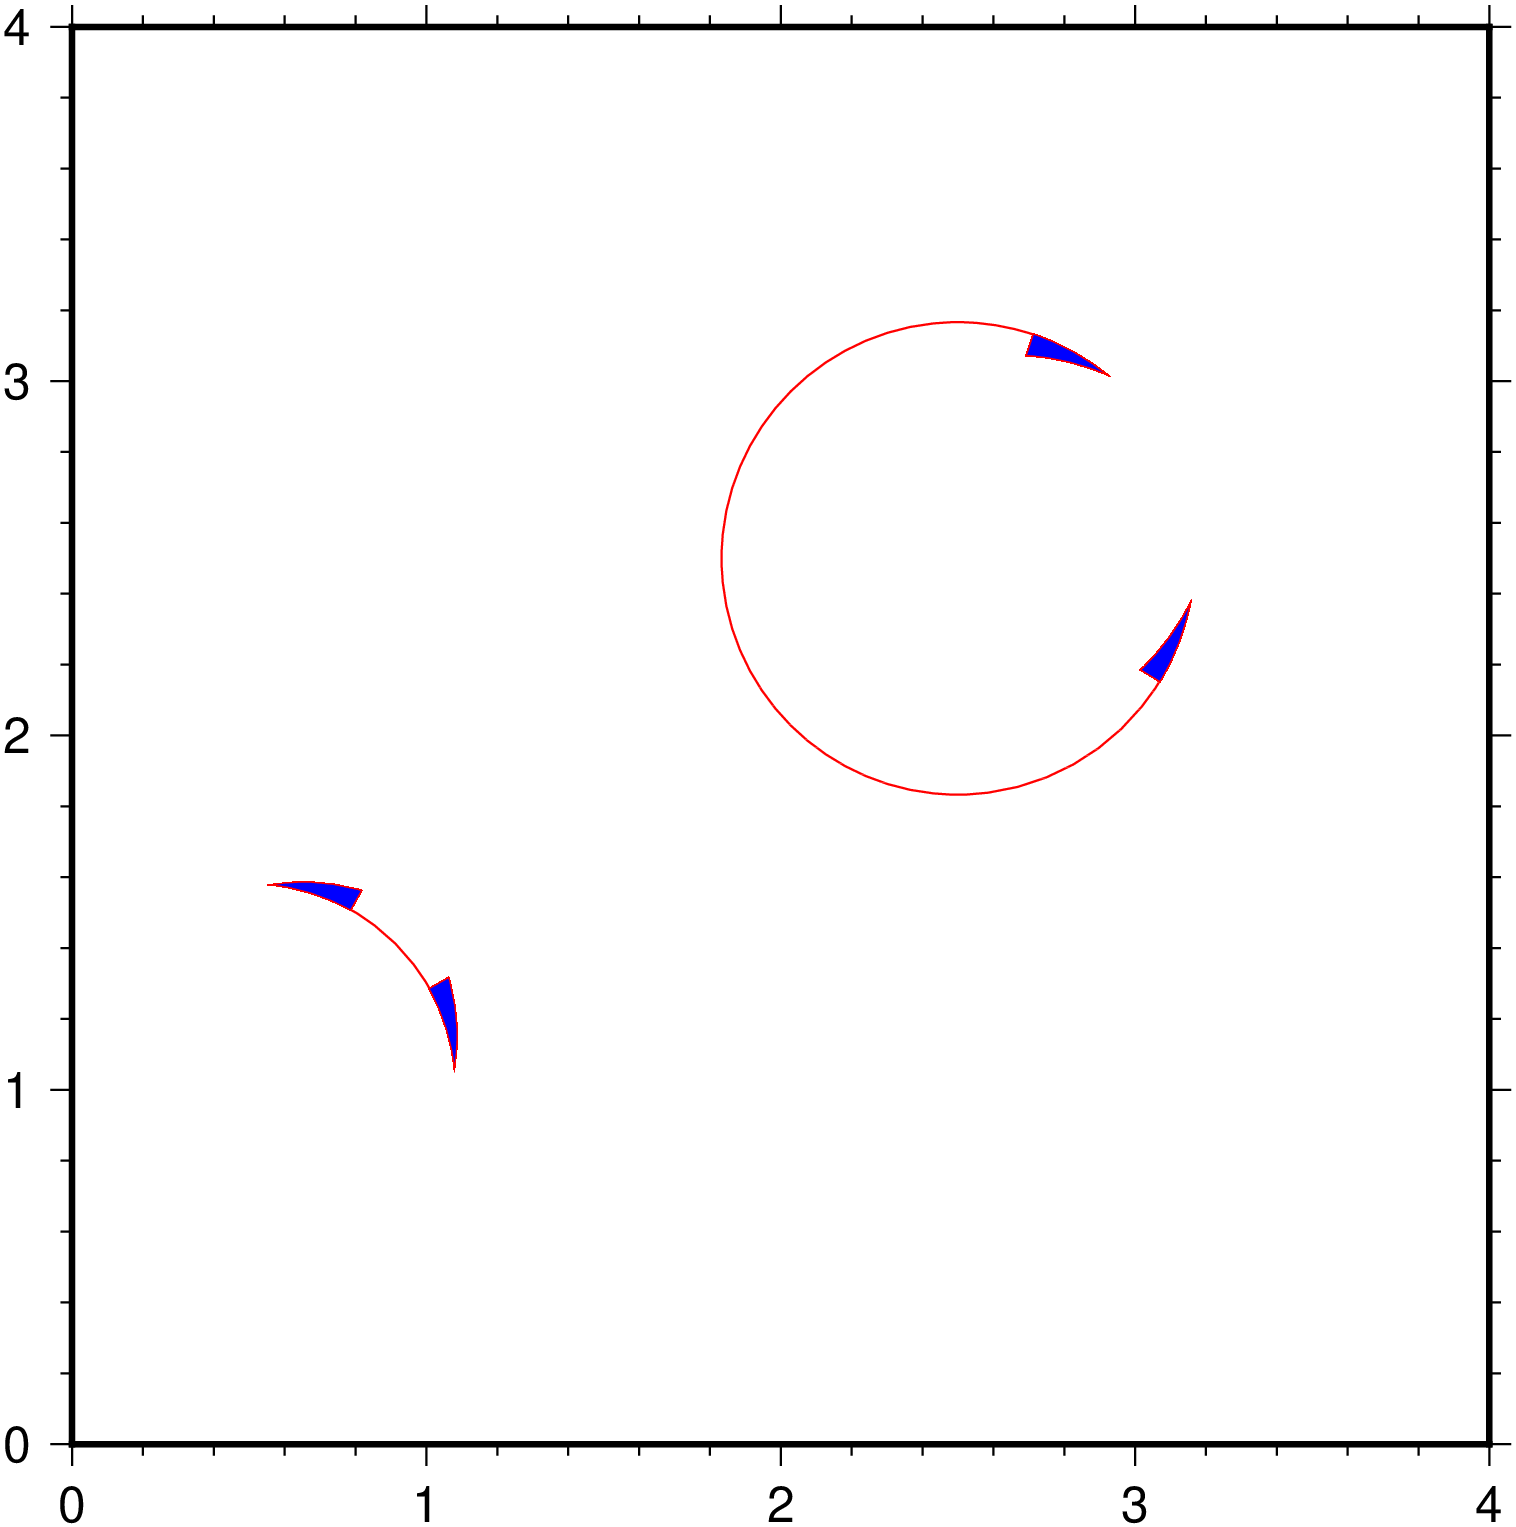
Matangles
Plot matangle symbols with vector heads.
# Plot the matangle symbol with location and angle params in input array.
plot([0.5 1 1.75 5 85], region=(0,5,0,5), figsize=12,
        marker=(matang=true, arrow=(length=0.75, start=true, stop=true, half=:right)),
        ml=(0.5,:red), fill=:blue)
# Now add another matangle symbol but transmit the angle parameters via the
# keyword. Note that in this case the arrow attributes are wrapped in a NamedTuple
plot!([2.5 2.5], marker=(:matang, [2 50 350], (length=0.75, start=true, stop=true, half=:left)),
        ml=(0.5,:red), fill=:blue, fmt=:png, show=true)