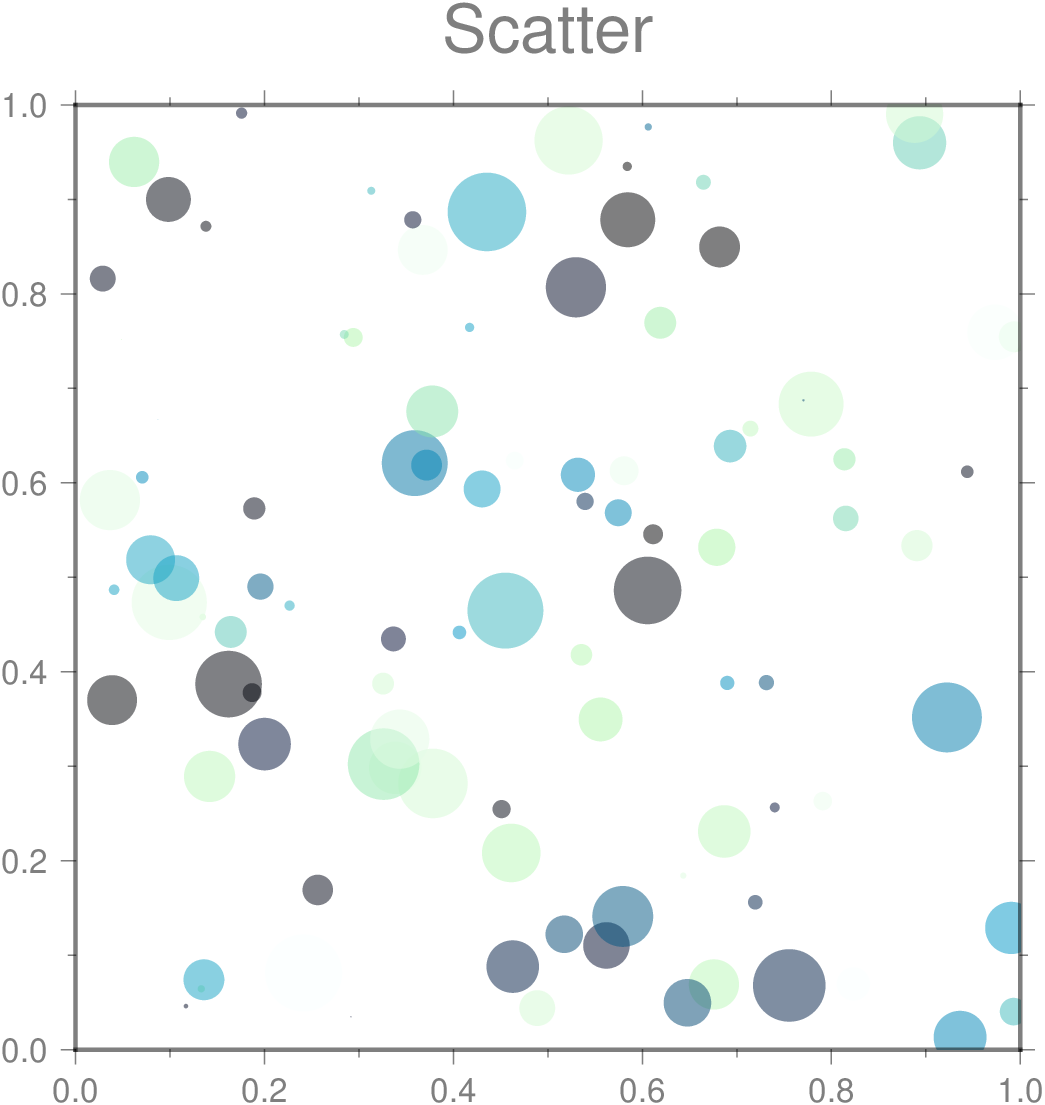
Variable symbol size/color Cartesian scatter plot
Draw a Cartesian scatter plot with variable symbol size, color and transparency
scatter(rand(100),rand(100),   # Generate data
        markersize=rand(100),  # Symbol sizes
        marker=:c,             # Plot circles
        color=:ocean,          # Color scale
        zcolor=rand(100),      # Assign color to each symbol
        alpha=50,              # Set transparency to 50%
        title="Scatter",       # Fig title
        figsize=12,            # Set fig size of 12 cm
        fmt=:png,              # The image format
        show=true)             # Show the result
As a one-liner (to facilitate copy-paste):
scatter(rand(100),rand(100), markersize=rand(100), marker=:c, color=:ocean, zcolor=rand(100), figsize=12, alpha=50, title="Scatter", fmt=:png, show=true)