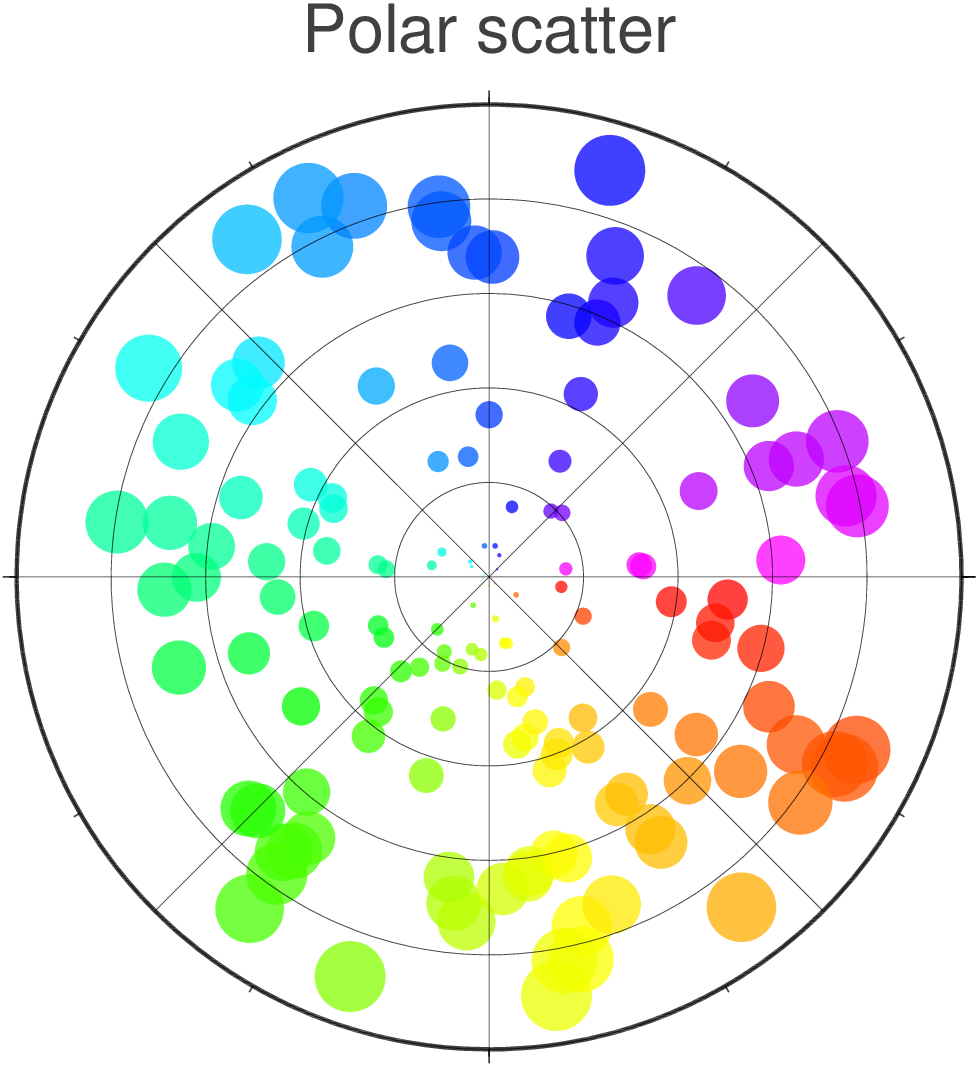
Variable symbol size/color Polar scatter plot
Draw a Polar scatter plot with variable symbol size, color and transparency. We will use the default color scale (rainbow) and fig size (12 cm).
teta = 2pi*rand(150)*180/pi; r = 9*rand(150); ms = r / 10;

scatter(teta, r,                  # The data
	limits=(0,360,0,10),      # Fig limits
        xaxis=(annot=45,grid=45), # Annotate and plor grid lines every 45 deg
        yaxis=(annot=2,grid=2),   # Same but for 2 units in radial direction
        proj=:Polar,              # Set the polar projection
        zcolor=teta,              # Assign color to each symbol
        size=ms,                  # The symbl sizes
        alpha=25,                 # Set transparency to 50%
        title="Polar scatter",    # Fig title
        fmt=:png,                 # The image format
        show=true)                # Show the result
As one-liners (to facilitate copy-paste):
teta = 2pi*rand(150)*180/pi; r = 9*rand(150); ms = r / 10;
scatter(teta, r, xaxis=(annot=45,grid=45), yaxis=(annot=2,grid=2), title="Polar scatter", proj=:Polar, limits=(0,360,0,10), zcolor=teta, size=ms, alpha=25, show=true)